
Introducing DarklyEnergized.com
A bold step forward for liquidity analysis.

What Inspired This App?
In 2022 when I first created my account on Twitter (as it was called before X), I didn’t exactly know where Darkly Energized was headed. It was an experiment back when I thought I could quit my job in a big company and go off on my own. I had some money saved, and a story to tell.
I found myself focused on central banks, liquidity, and how markets are affected by these factors. Due to my background in software development I decided to make some TradingView indicators to express my ideas. It turns out many other people were interested in these as well. Dark Energy Divergence Oscillator (DEDO) was my first indicator. When I gave away the formula for free about 3 years ago, some big accounts (such as Eliant) shared it, putting my account on the fintwit map.
Eventually I created more indicators, all using the central bank data to visualize the movements in different ways. I added more features along the way, posting charts as the features progressed. TradingView eventually followed me, and offered support, but there are still some reasons to branch off with a new app, which I will get to shortly.
I started this blog on Substack to share regular research, and decided to do a weekly liquidity report which was written alongside the FRED data drop each week. I used to spend all day Friday (Malaysia time) preparing the report while most of you were asleep (Thursday night US time). I was also finishing my book, Blockhead, which finally got published days before the Bitcoin halving in 2024. Back in those days I would often stay up until 4 am hosting X spaces during market hours.
After the book launch, I was getting groomed for a CTO role at a fintech company here in SE Asia. I wanted to join because I figured it would be a learning experience, and it certainly has gone above and beyond that expectation. Being in the founder mindset again has changed a lot for me, and one of those changes was laser focus on the company mission. Darkly Energized was left idle most days.
Today I’m announcing that Darkly Energized is back, and evolving with a new registered company Darkly Energized LLC, founded February 2026. The first company offering is the main topic of this article: darklyenergized.com.
The DE Difference
Why does this app exist?
TradingView indicators don’t have access to daily Treasury General Account (TGA) data. I always had to work around this with an offset setting that the user of the indicator would have to manually update.
Maintaining Pine Script and working within the TradingView sandbox can only take you so far before you want to do more. The limitations leave a lot to be desired.
The time has come for AI to plug into Darkly Energized indicators. By offering API+MCP, and web-hooks, DE is plug and play with agentic systems, and non-AI systems that automate data analysis.
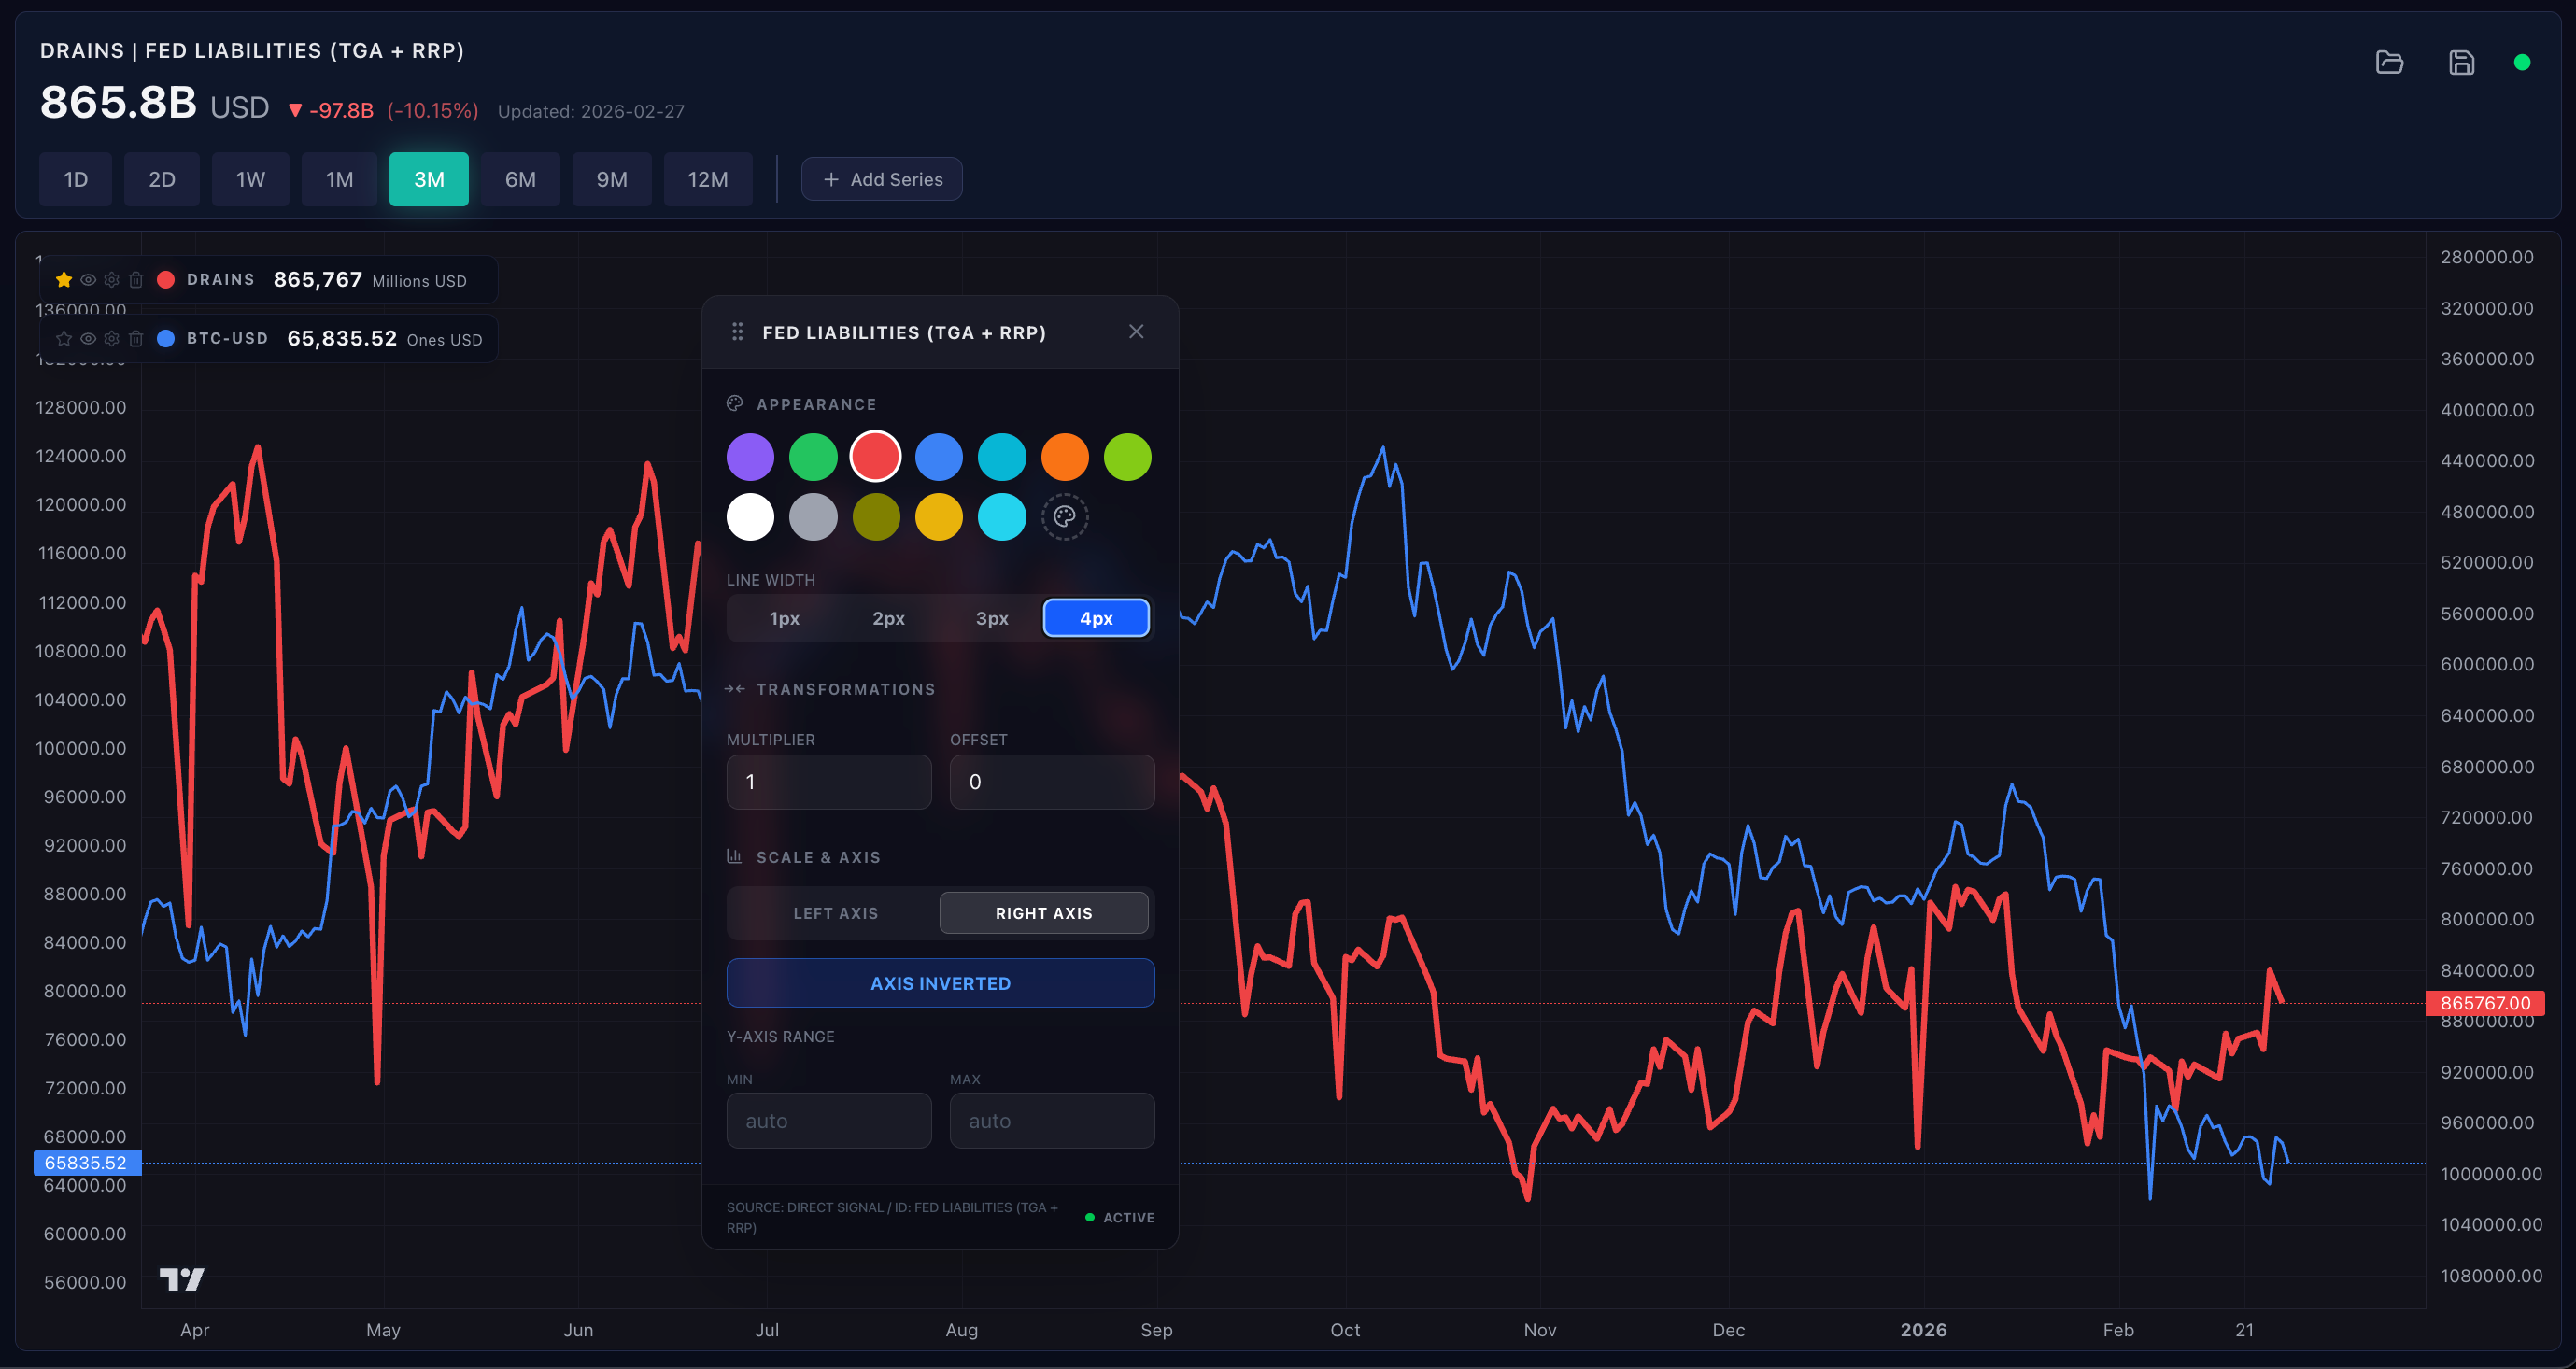
The primary differentiator in my app is data merging which incorporates daily TGA data from the treasury.gov API, and the FRED weekly data. By prioritizing the daily data in the signal, you get the most up-to-date moves in all equations and indicators by default (no special settings). To demonstrate the effects of this innovation (which is not available on TradingView at this time) I present WRESBAL+ in the darklyenergized.com charting page:
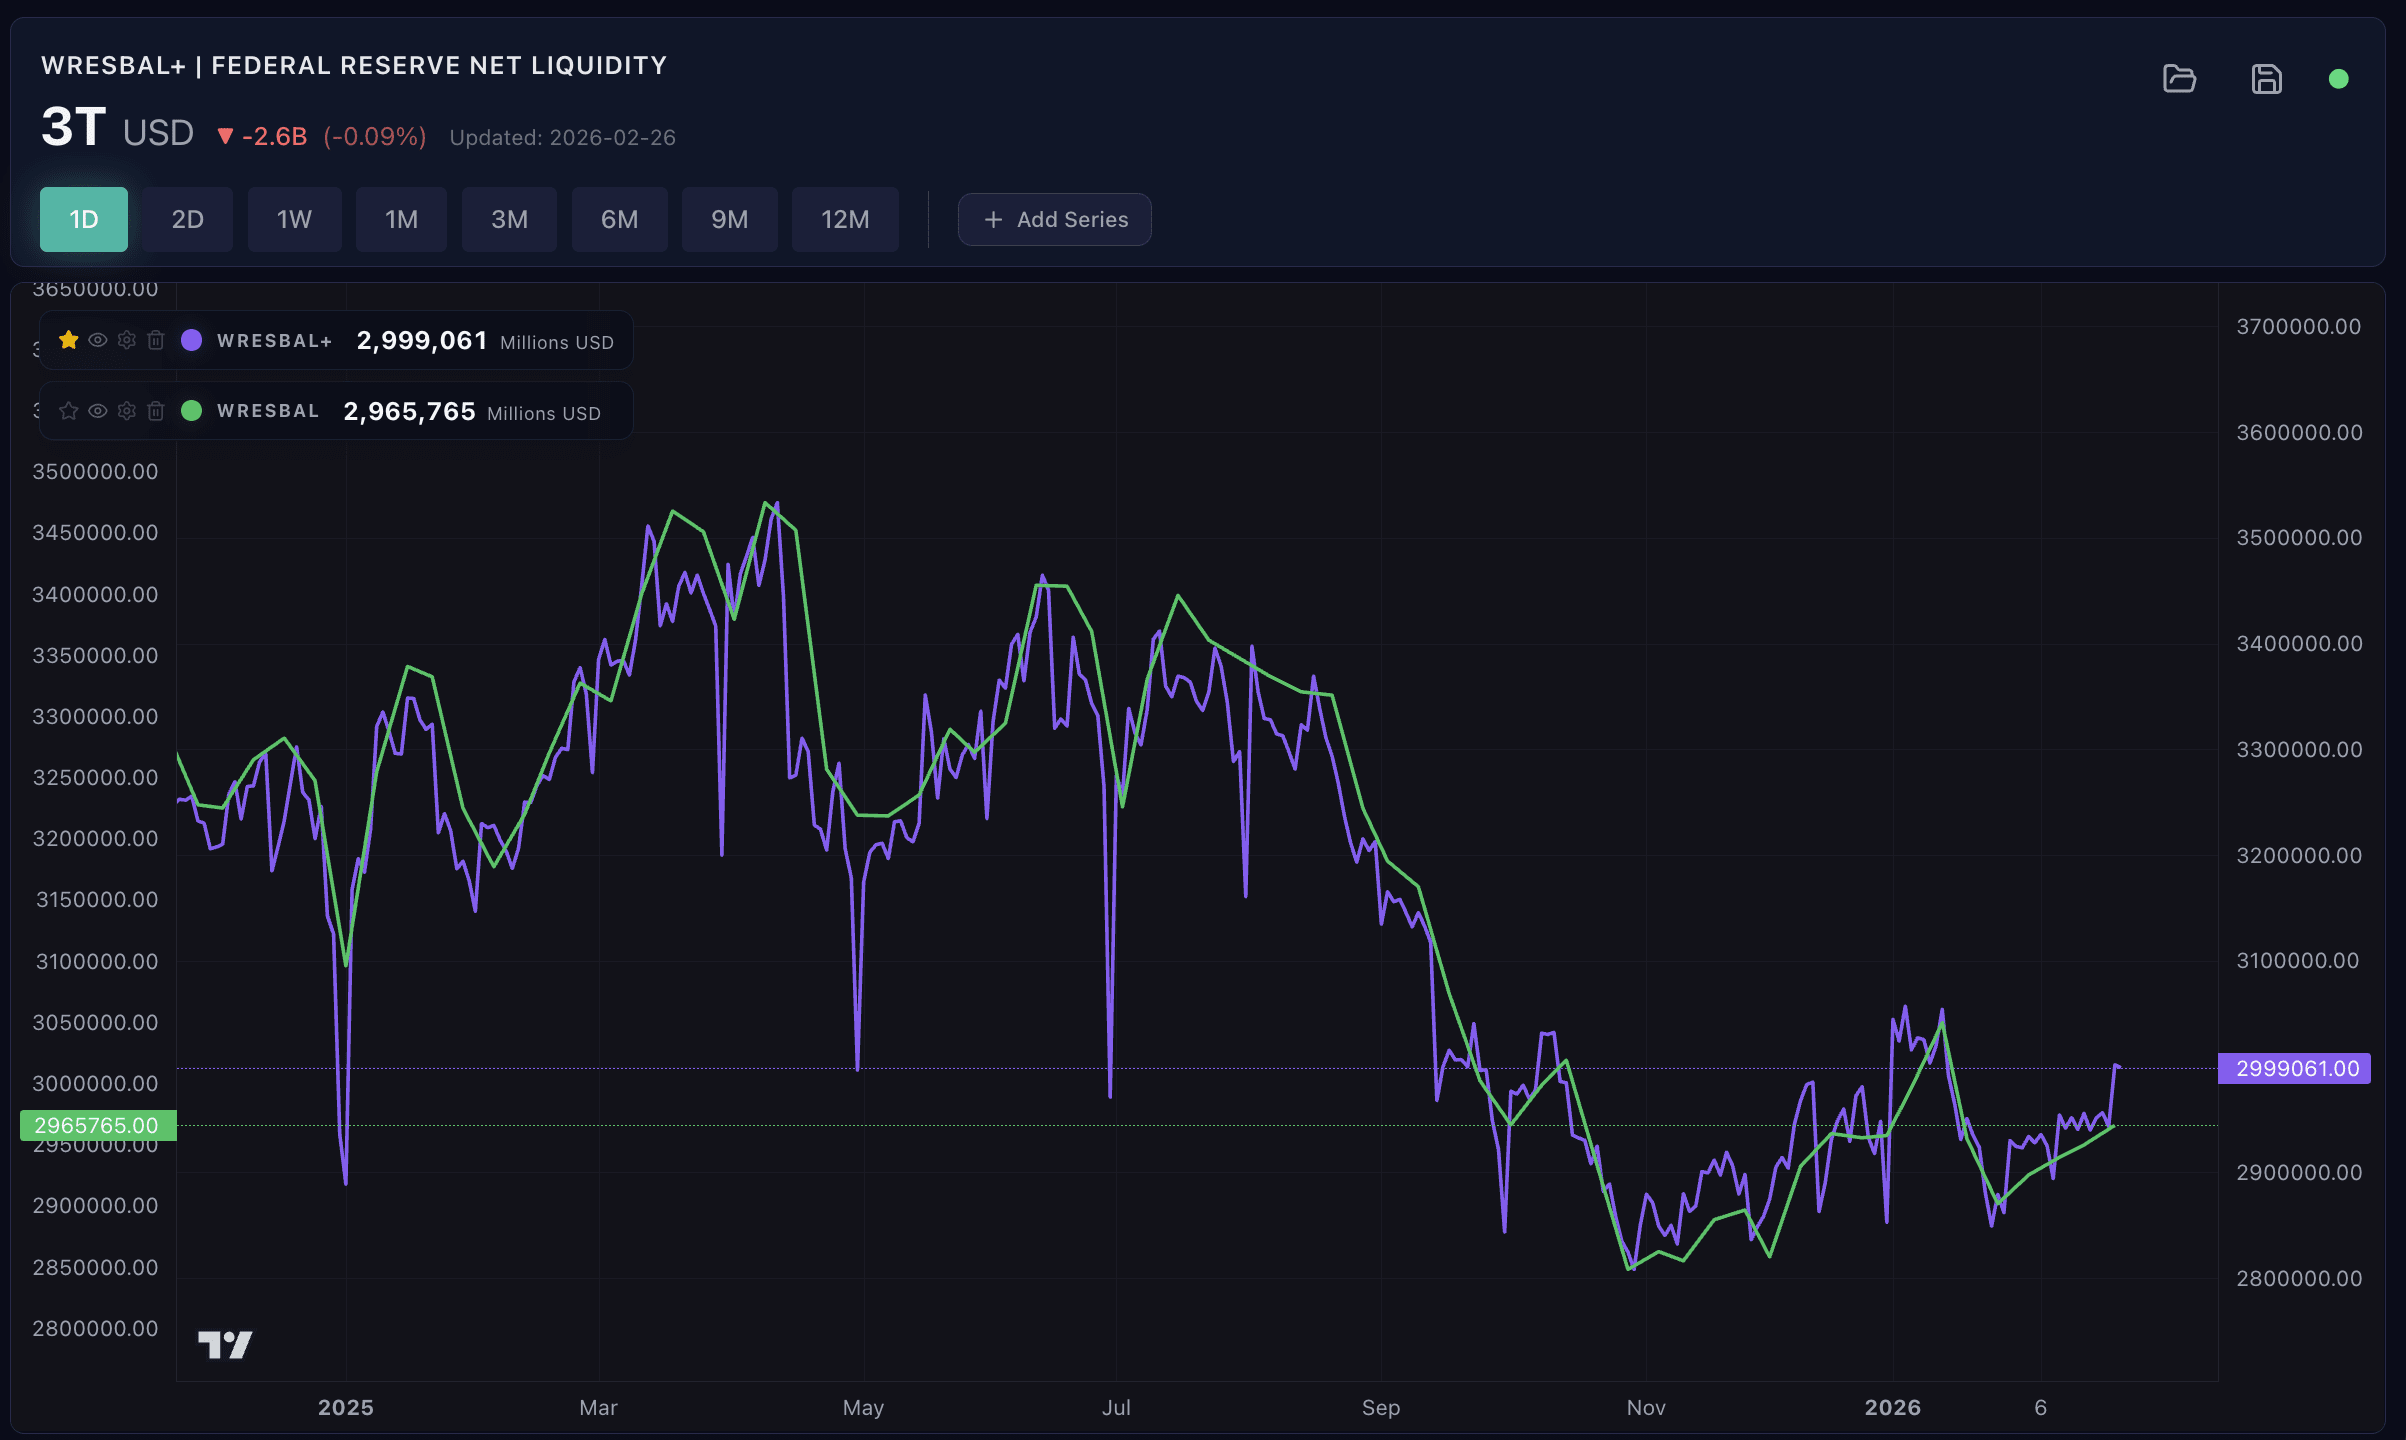
Here you can see the nuance in WRESBAL+ vs WRESBAL (FRED). There is no TGA offset setting needed. The built-in “series generator” as it is called in the code is designed to consume the most up-to-date signals to produce the output data in the series. There is no question that the WRESBAL+ signal is more nuanced, and moves earlier to the level WRESBAL (FRED) will be going when it prints each week.
If you are curious about WRESBAL, checkout my original Substack on the topic: Federal Reserve Series: What is WRESBAL?
Embracing the Niche
A secondary differentiator is my ability to customize the app, and provide updates based on feedback without being limited on another platform.
DarklyEnergized.com can evolve to be what everyone wants to see in this focused area of market research. The focus being liquidity analysis makes it more streamlined as a supplementary tool to more general systems.
Agentic Finance
AI is evolving fast, and giving agents access to APIs and MCP (Model Context Protocol) was a must-have feature for DE. One of the coolest things I’ve seen is using natural language to interact with my indicators in Claude Code.
The prompt: “Draw an ASCII based chart of CBDET with /mcp over a 10 year timeframe. show min and max on the chart”

With Darkly Energized MCP configured the /mcp directive is all it takes for Claude to look in the toolbox for the service that knows about CBDET, and off it goes hunting for the data, and preparing the ASCII chart right there in the CLI. I didn’t even ask for the “story in three acts”…it added that analysis on its own.
The AI and automation possibilities are endless with API+MCP.
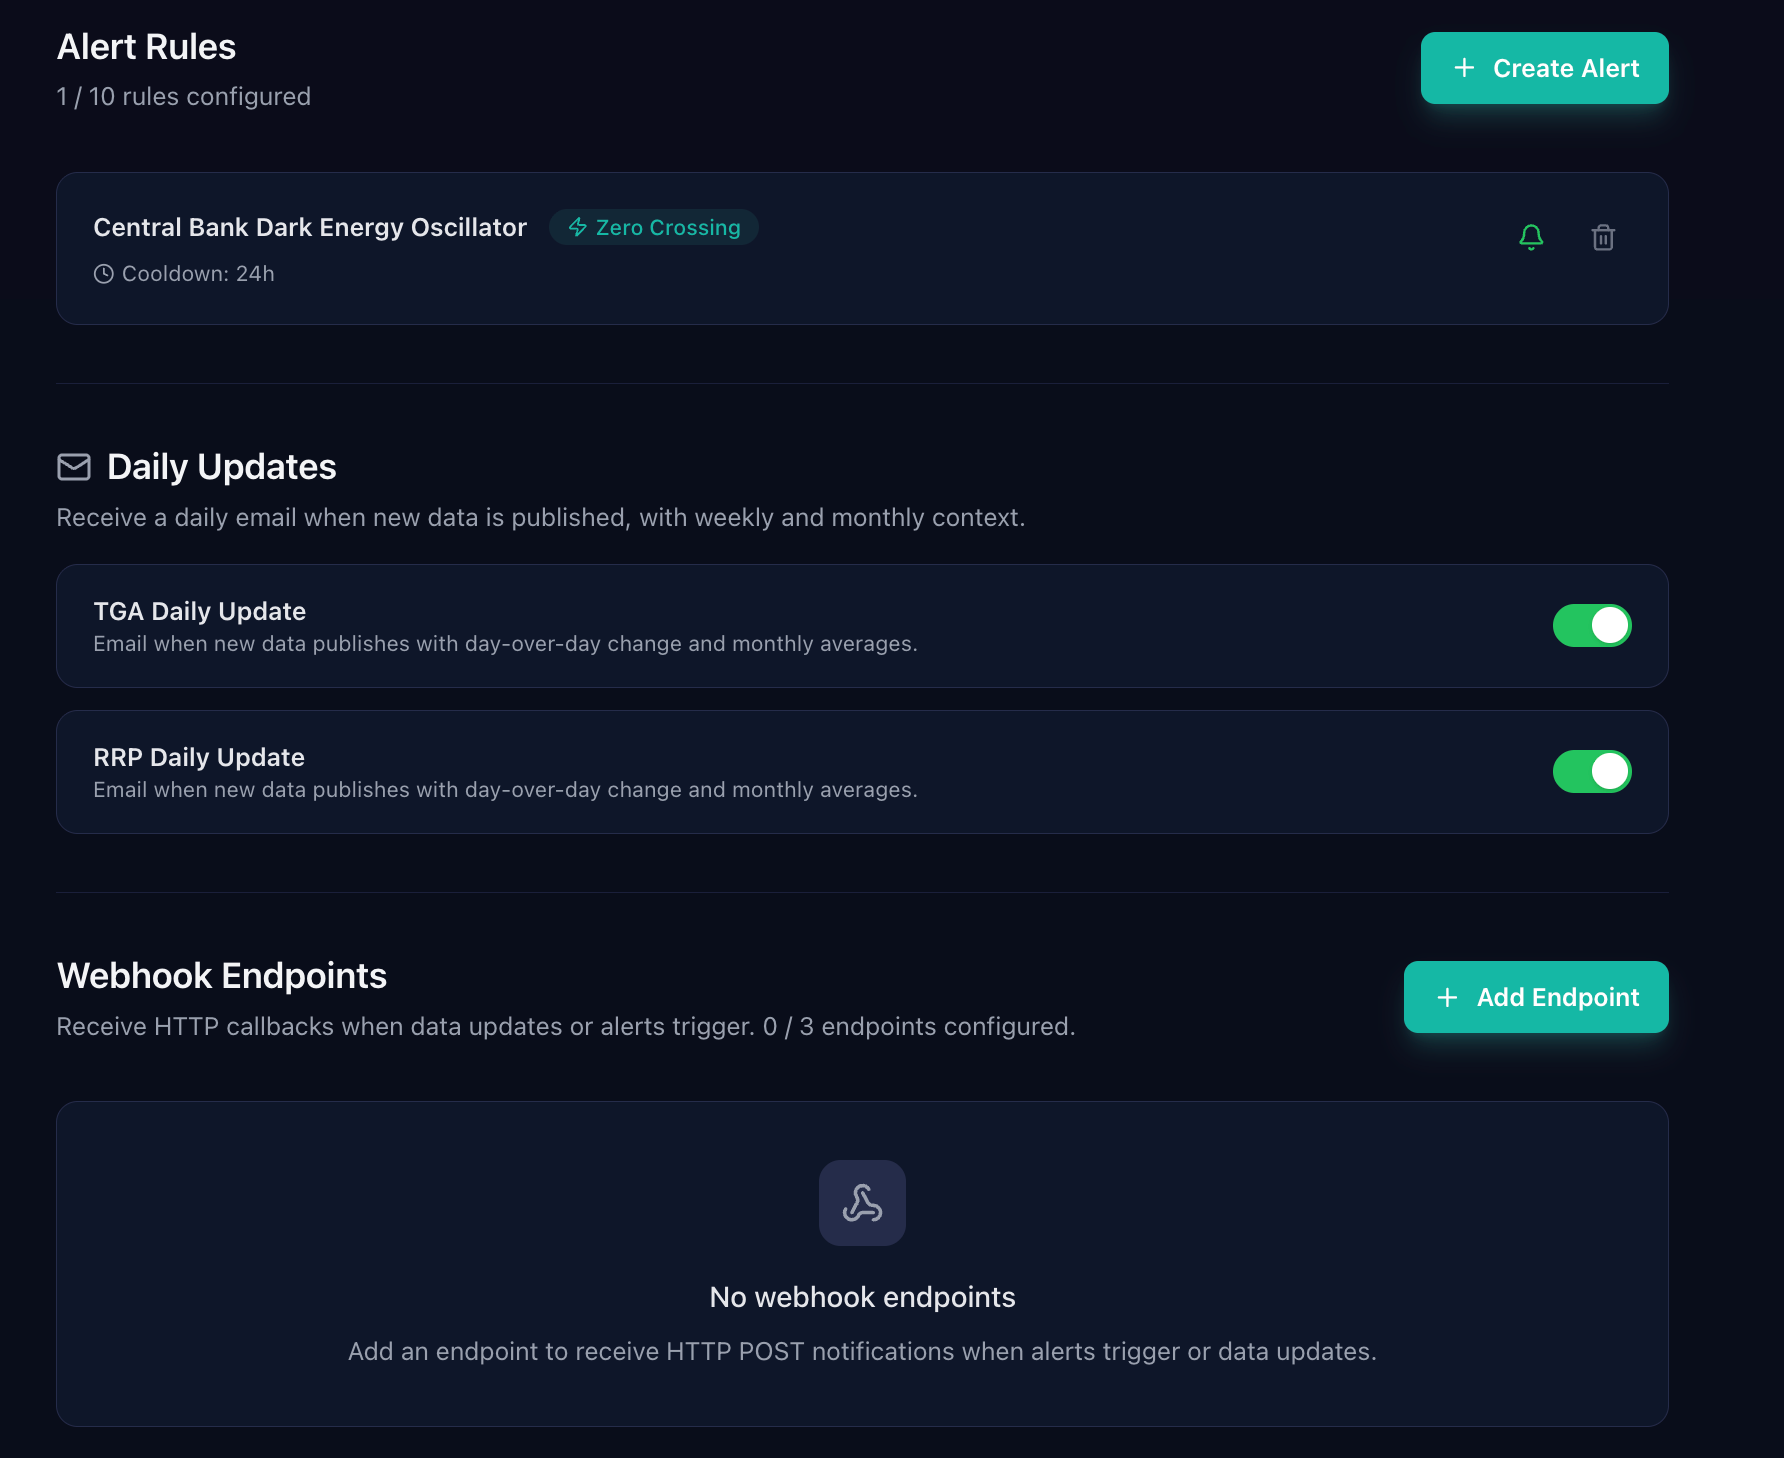
Alerts and Webhooks
For those that have followed me on X to get daily TGA and RRP updates, this feature is for you…or maybe it’s for me so I can automate those updates on X. Either way, enjoy updates on the latest TGA and RRP (and other) data within minutes of the data drop on the official API sources (FRED and Treasury.gov). Darklyenergized.com has a data sync engine that will trigger automated updates so that you get notified quickly as the liquidity landscape evolves.
Signals and Central Banks
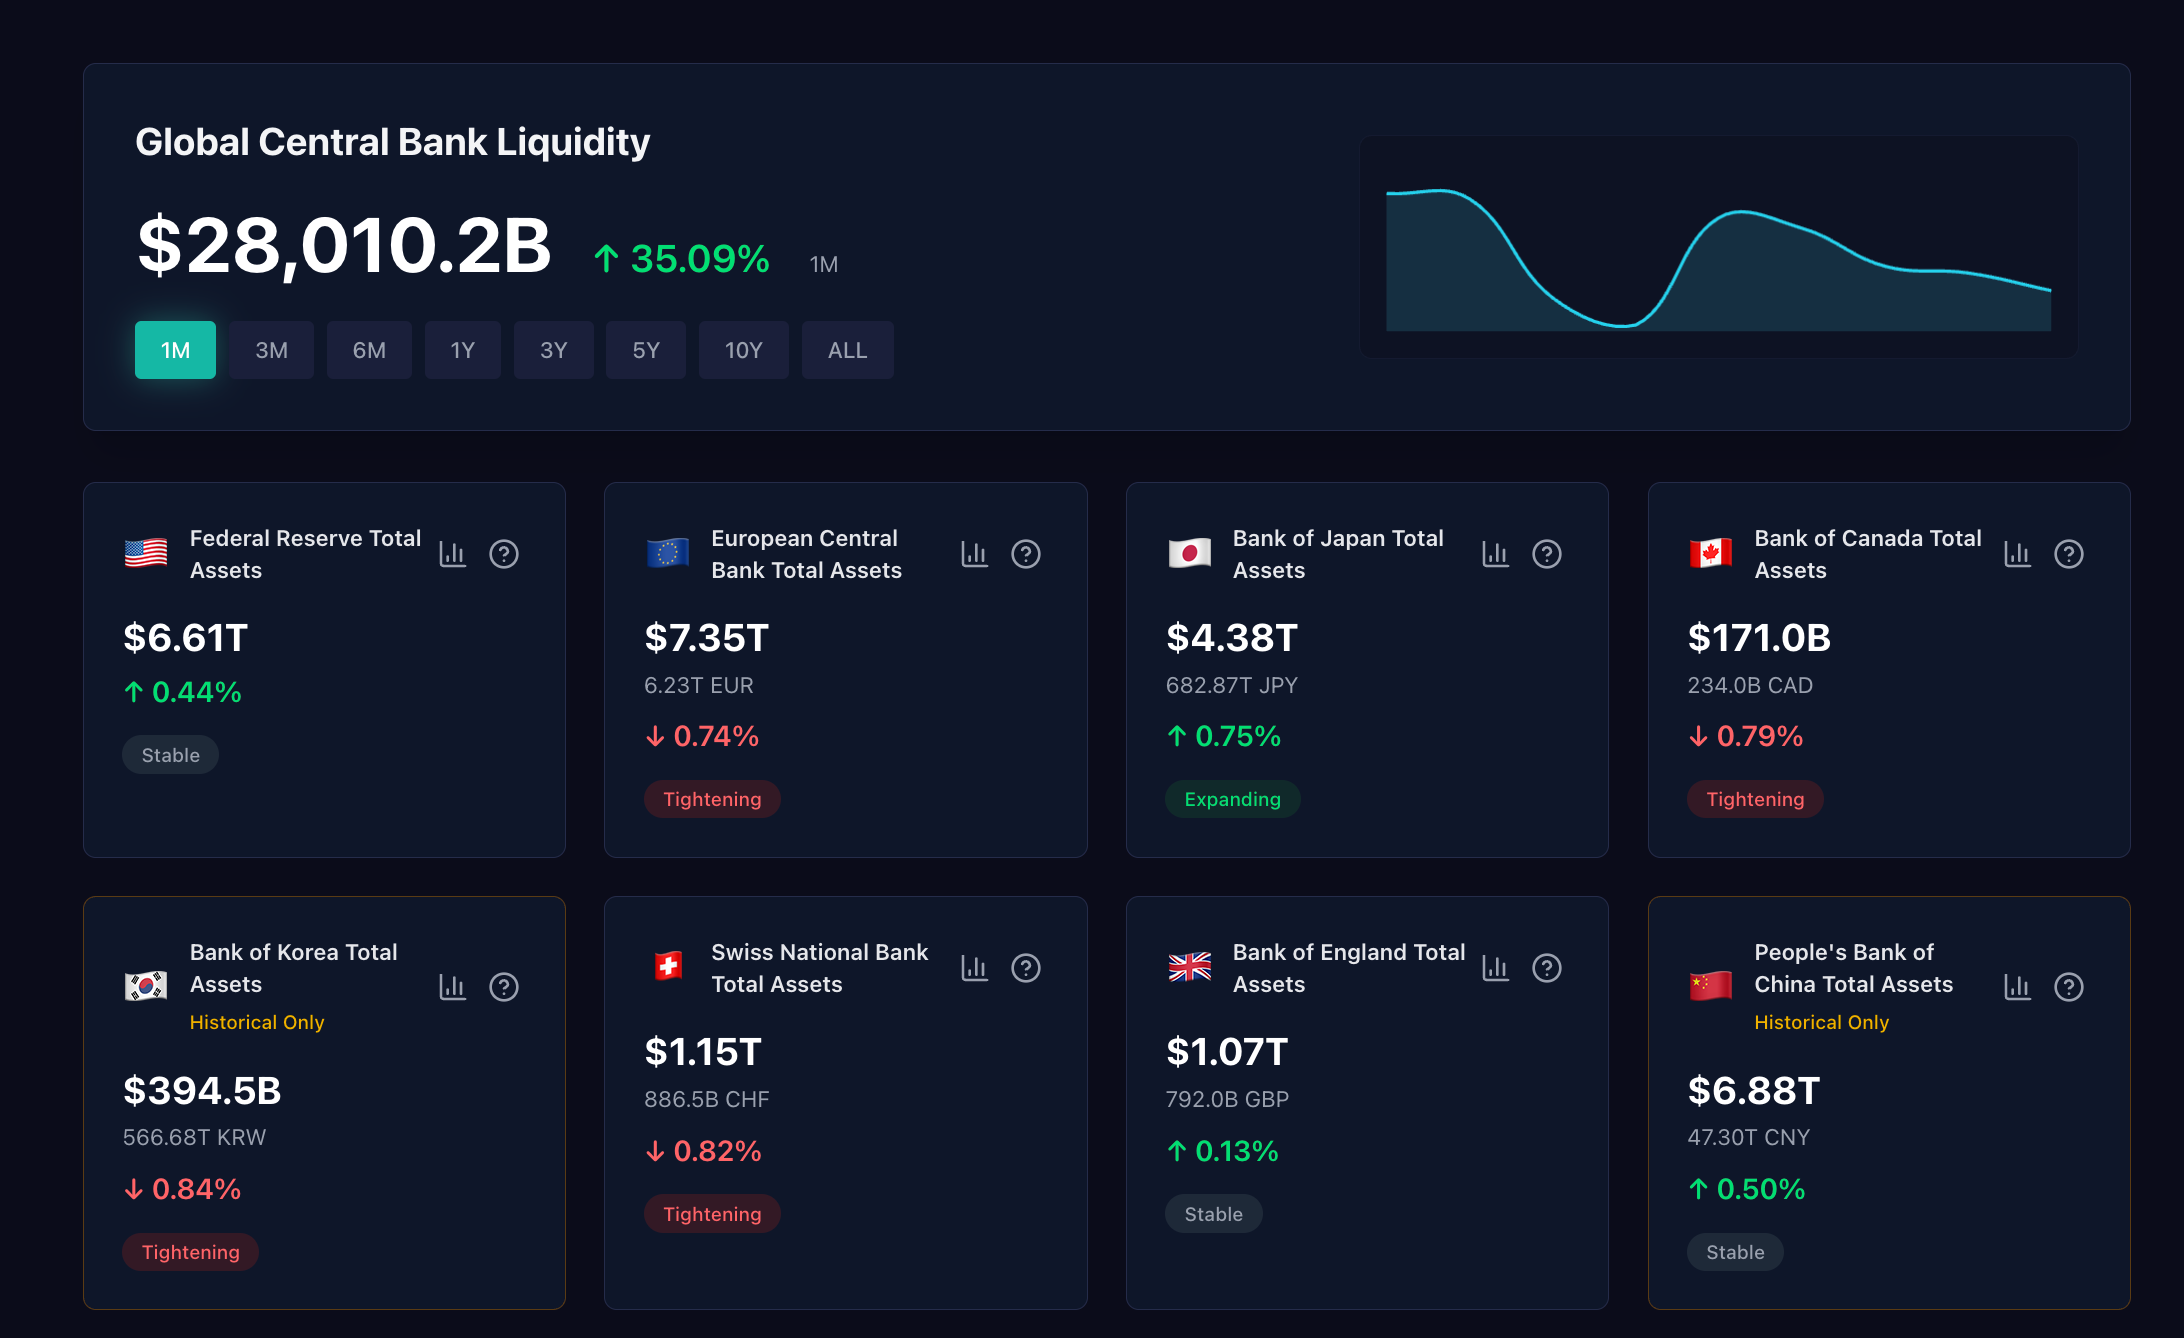
The DE app comes free with data from BIS, FRED, and others (attribution included in app), and the UI has a few modes of viewing the data. First, there is a dedicated “Central Banks” page including a tiled collection view of all balance sheets:
The ‘?’ will provide much detail on the data source and information about the expected frequency in updates. For example, here is what it looks like accessing the ‘?’ for the ECB
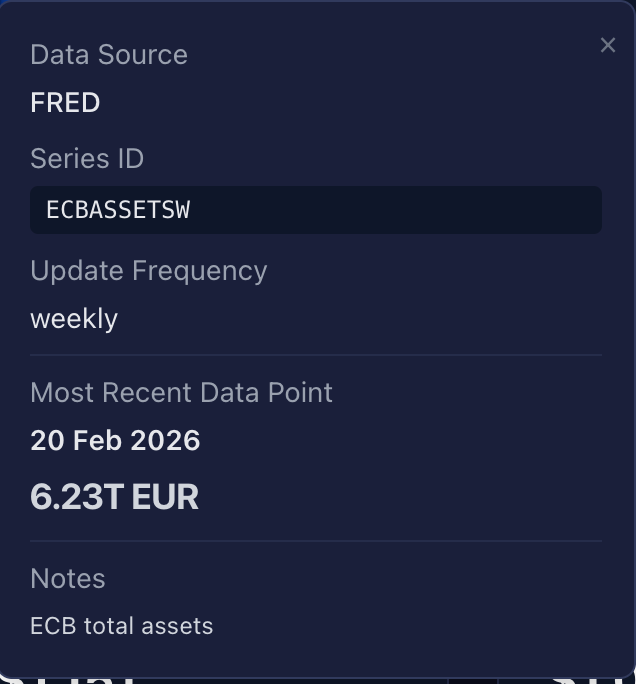
For full transparency and attribution, I am including information about every single data stream on a signal status page. The page will load all data streams, and provide a card for each explaining what it is, providing info about the data source. There is filtering to focus on specific types such as crypto, FX, liquidity, etc.
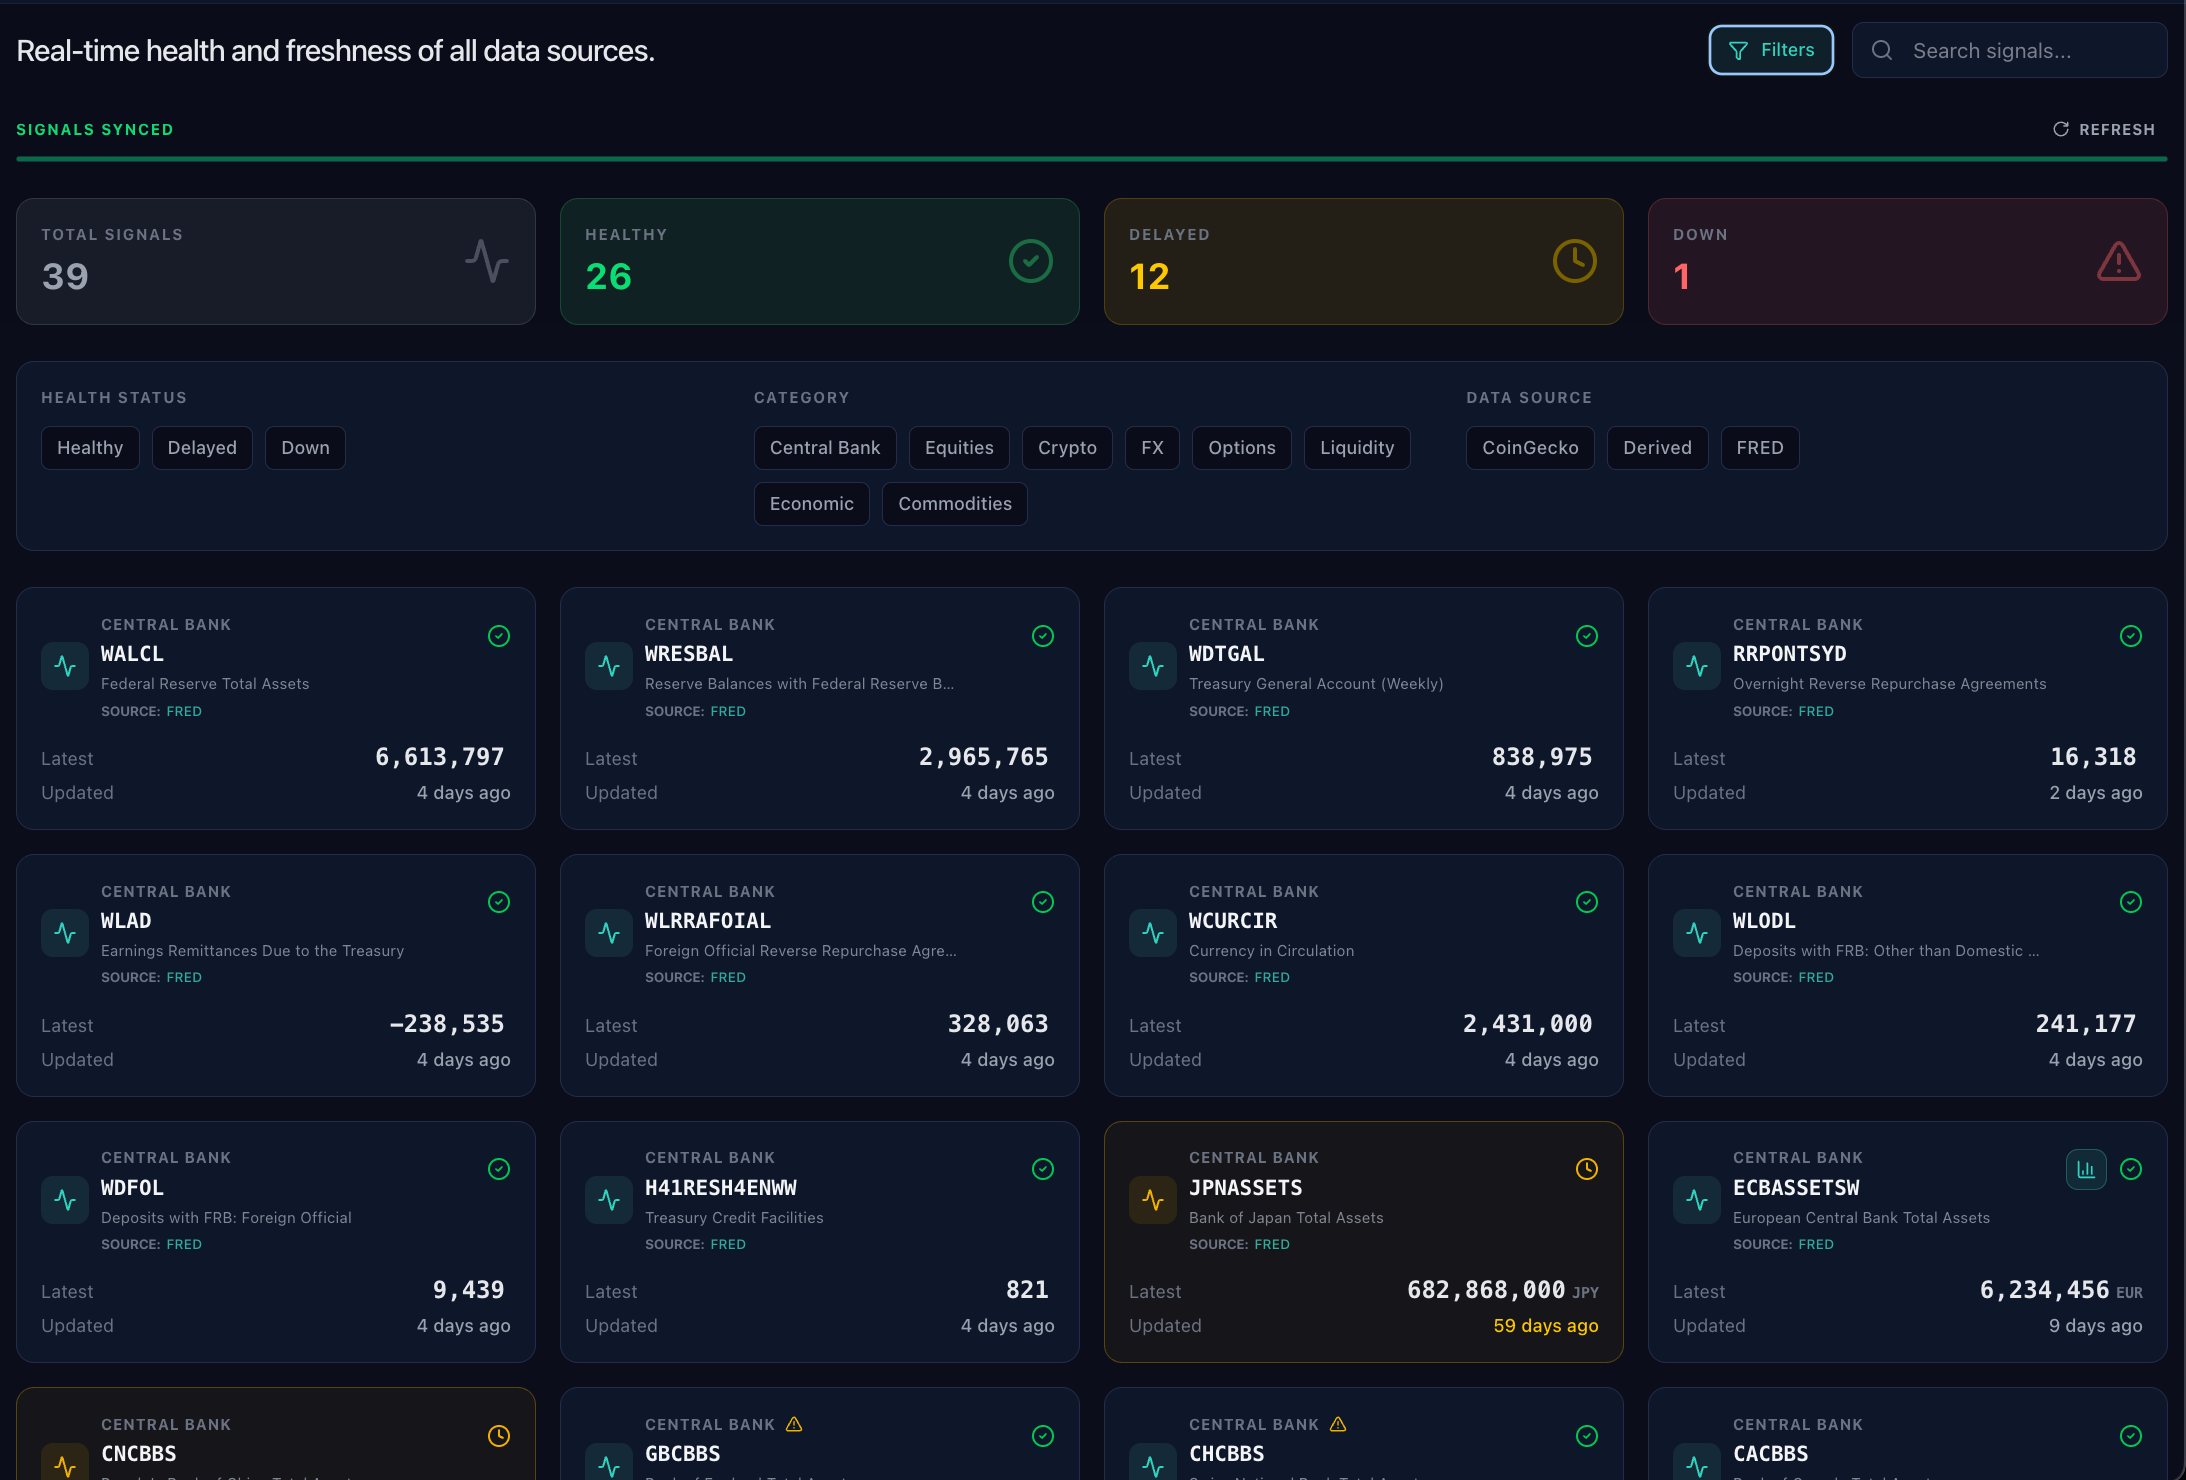
The signal health is scored based on a pre-determined freshness factor tailored to the frequency of the data stream. Central bank data is infrequent, and often delayed, which you can see here in some of the cards.
Notes for Future Updates
The app is new and there is plenty more that can be done. As feature updates roll out, many of them will be available in the free account tier. Paid tiers will also get exclusive features. There were many things I wanted to do that ended up getting cut for this first release. For example Dark Energy Divergence Oscillator (DEDO), the indicator that started it all. It had to be left out due to SPX data licensing issues. For some data I need to procure a business license allowing commercial use, and some of these are expensive.
There are paid tiers for the premium features that will require me to scale infrastructure with enough users. If the revenue from paid tiers allows, I will be able to acquire licenses for more data, and provide many more features.
Central Banks
I plan on adding more central banks to the list on the CBs page. There are still many more that have an influence on global liquidity, and if I missed your country please let me know!
I can also research getting direct API access to some central banks. This might enhance the app with more up-to-date data, providing an edge in the analysis game.
Data Improvements
Many of the signals are limited such as CoinGecko’s crypto data on the free API tier. To go back many years with the data comes with significant cost in most cases. Improving on historical data is possible, but I will need to assess the budget and demand for features to prioritize appropriately.
Charts
The chart feature in the app is very simple. It allows a maximum of two series. This is due to a limitation in Lightweight Charts™ by TradingView.
The LW Charts module is a gem, but it doesn’t have all the full TradingView chart features. It is meant to be light, and easy to implement. With a custom-built settings panel, it becomes quite functional. The two series limitation comes from only having two axes to work with: left and right. I can do more research on LW charts to see what other options are available, and update the charting system with new capabilities.
Final Thoughts
The Darkly Energized story continues with darklyenergized.com.
I’m looking forward to working with the community of traders and investors out there who want better liquidity data and analytics, with support for modern AI workflows.
Sign up free today, and start tracking liquidity with power tools.
For a limited time use promo code DELAUNCH for a free month on the “Basic” tier which allows for a trial of the API/MCP feaures.
I ran to subscribe. Been following on x and here...I will be there. Thanks.