
Explainer: Dark Energy Divergence Oscillator (DEDO)
Guide explaining DEDO Equations & TradingView Indicator

What is DEDO?
DEDO is a method of calculating divergence (the 2nd ‘D’) between two variables: market liquidity, and asset valuation. The first version of DEDO is an equation that can be plugged into TradingView:
FRED:WRESBAL/4276000000000-(SP:SPX-1255.08)/3563.54WRESBAL is a Fed balance sheet data set that can be viewed on the FRED website. For anyone interested in diving deeping into WRESBAL, see my explainer which dissects the individual components.
SP:SPX is the ticker for the S&P 500 index.
Overlaying WRESBAL (orange) on SPX shows that central bank liquidity is highly correlated with price moves in major indices:
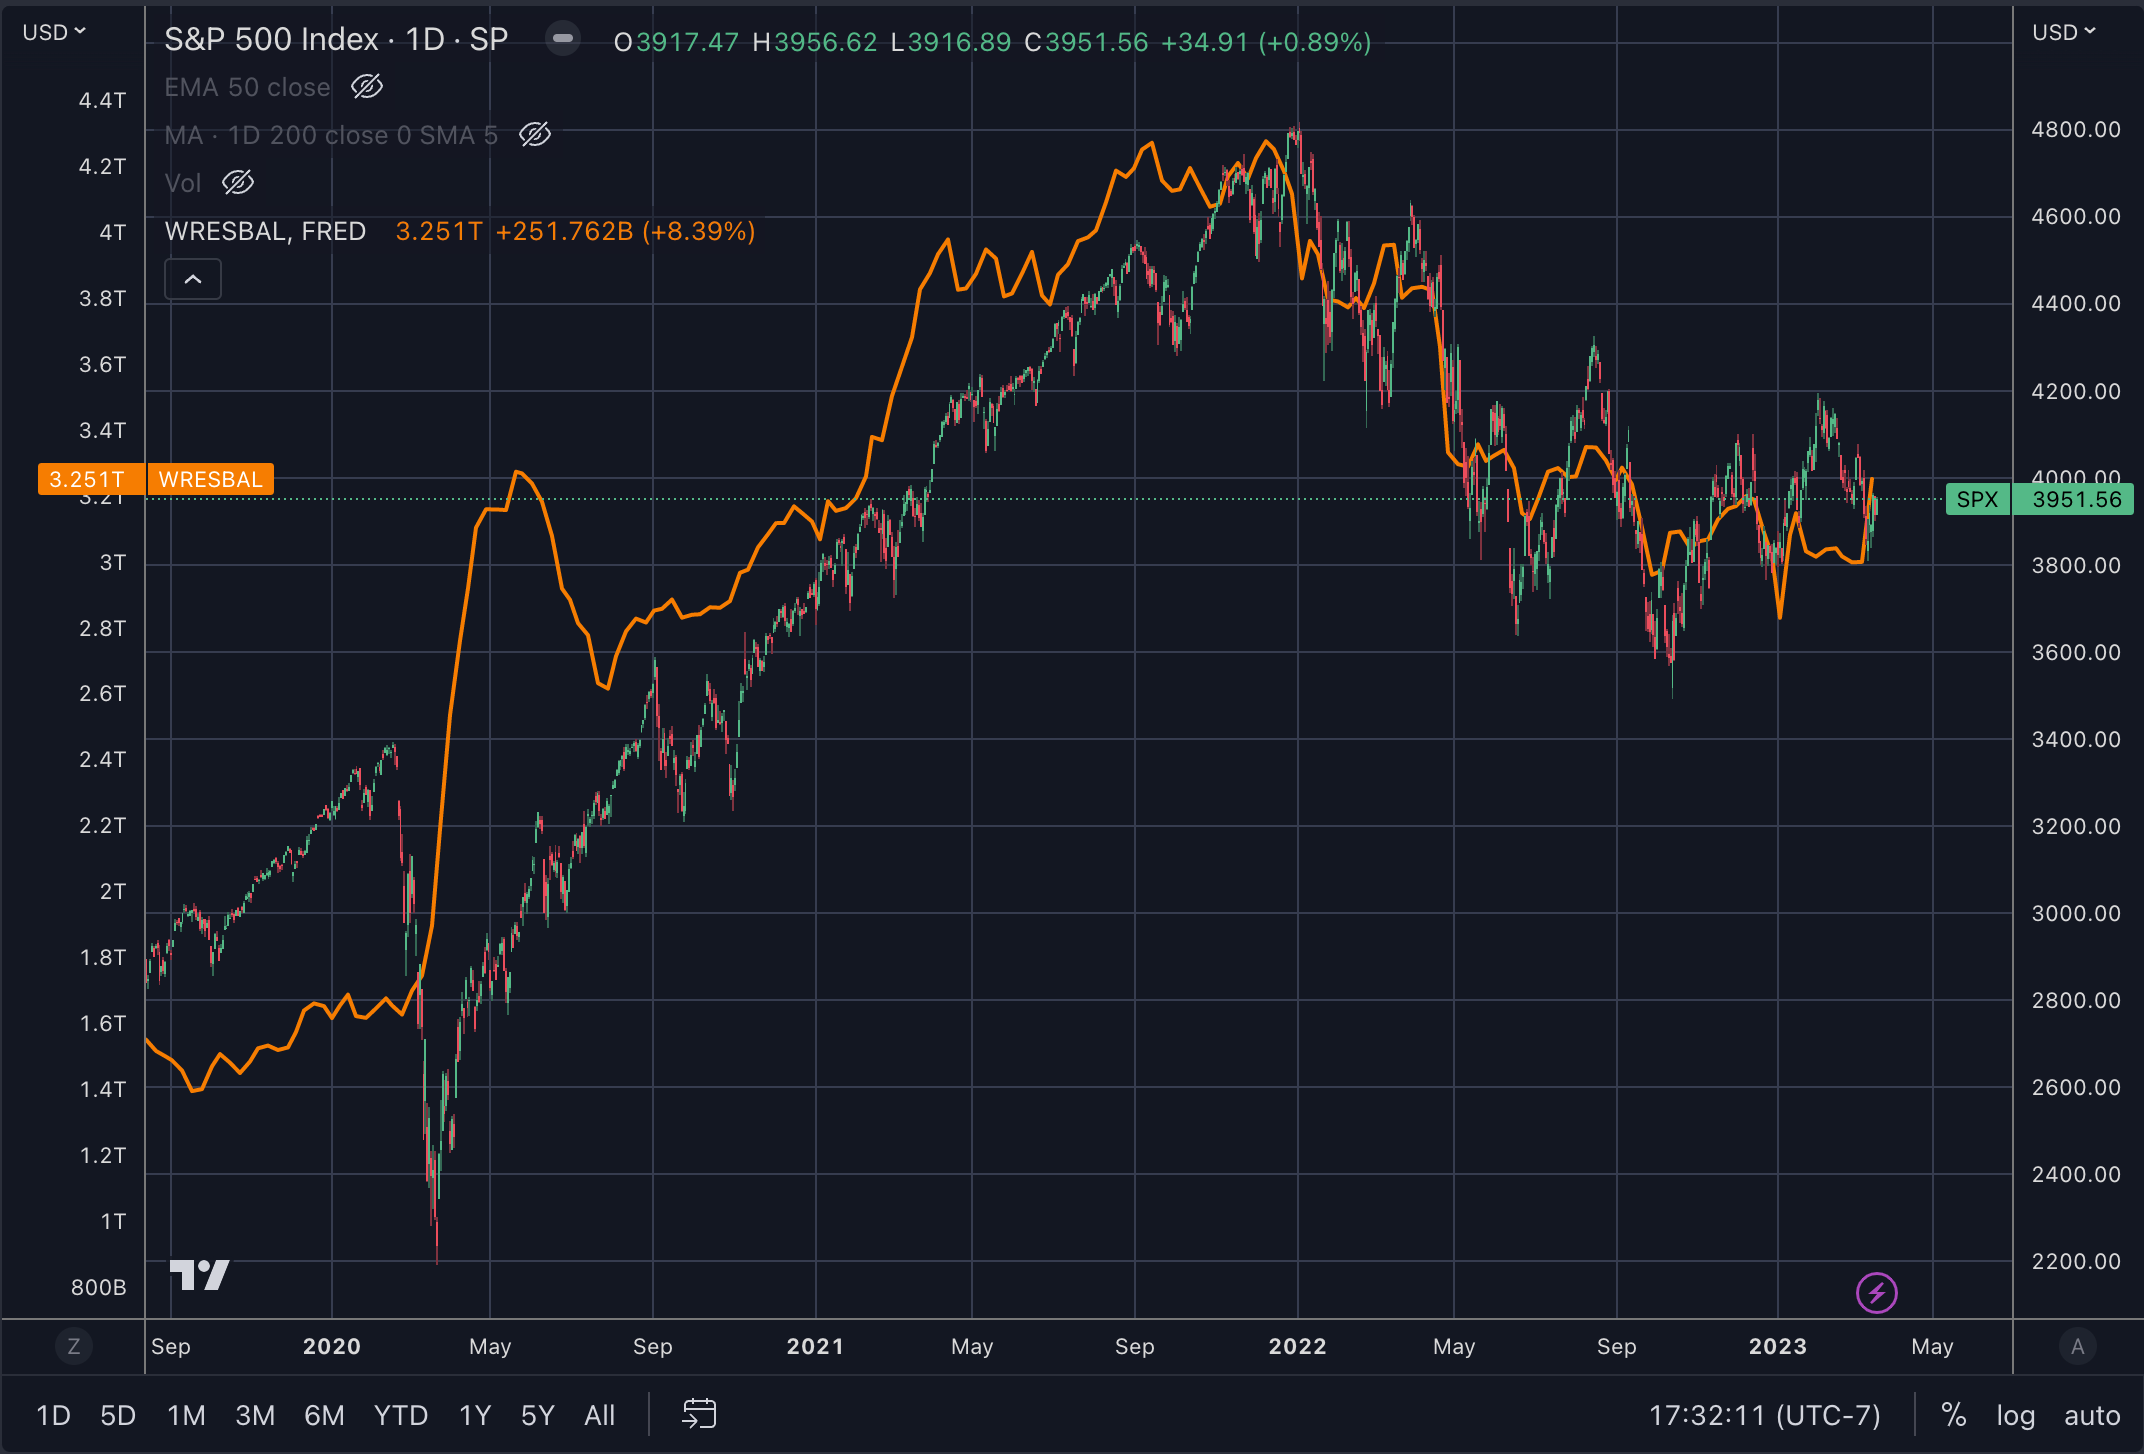
WRESBAL is in TRILLIONS of dollars, and SPX is an index, so how did I combine these?
First, we don't want "non-QE" data. we only want data for the market affected by QE because that's when this pump juice took over the whole ponzi. Find SPX on the day pre-ponzi: 1255.08 and subtract that from the top 4818.62 = 3563.54
With this post-QE SPX range, now you can normalize the price level simply by dividing by the range = (SPX-1255.08)/3563.54.
Normalization provides values from 0 to 1 so that you can compare them with other normalized figures.
Now we need to test that normalized 0 to 1 measure against the liquidity number, WRESBAL. Same idea, normalize it using the max as the denominator and you get a 0 to 1 liquidity index:
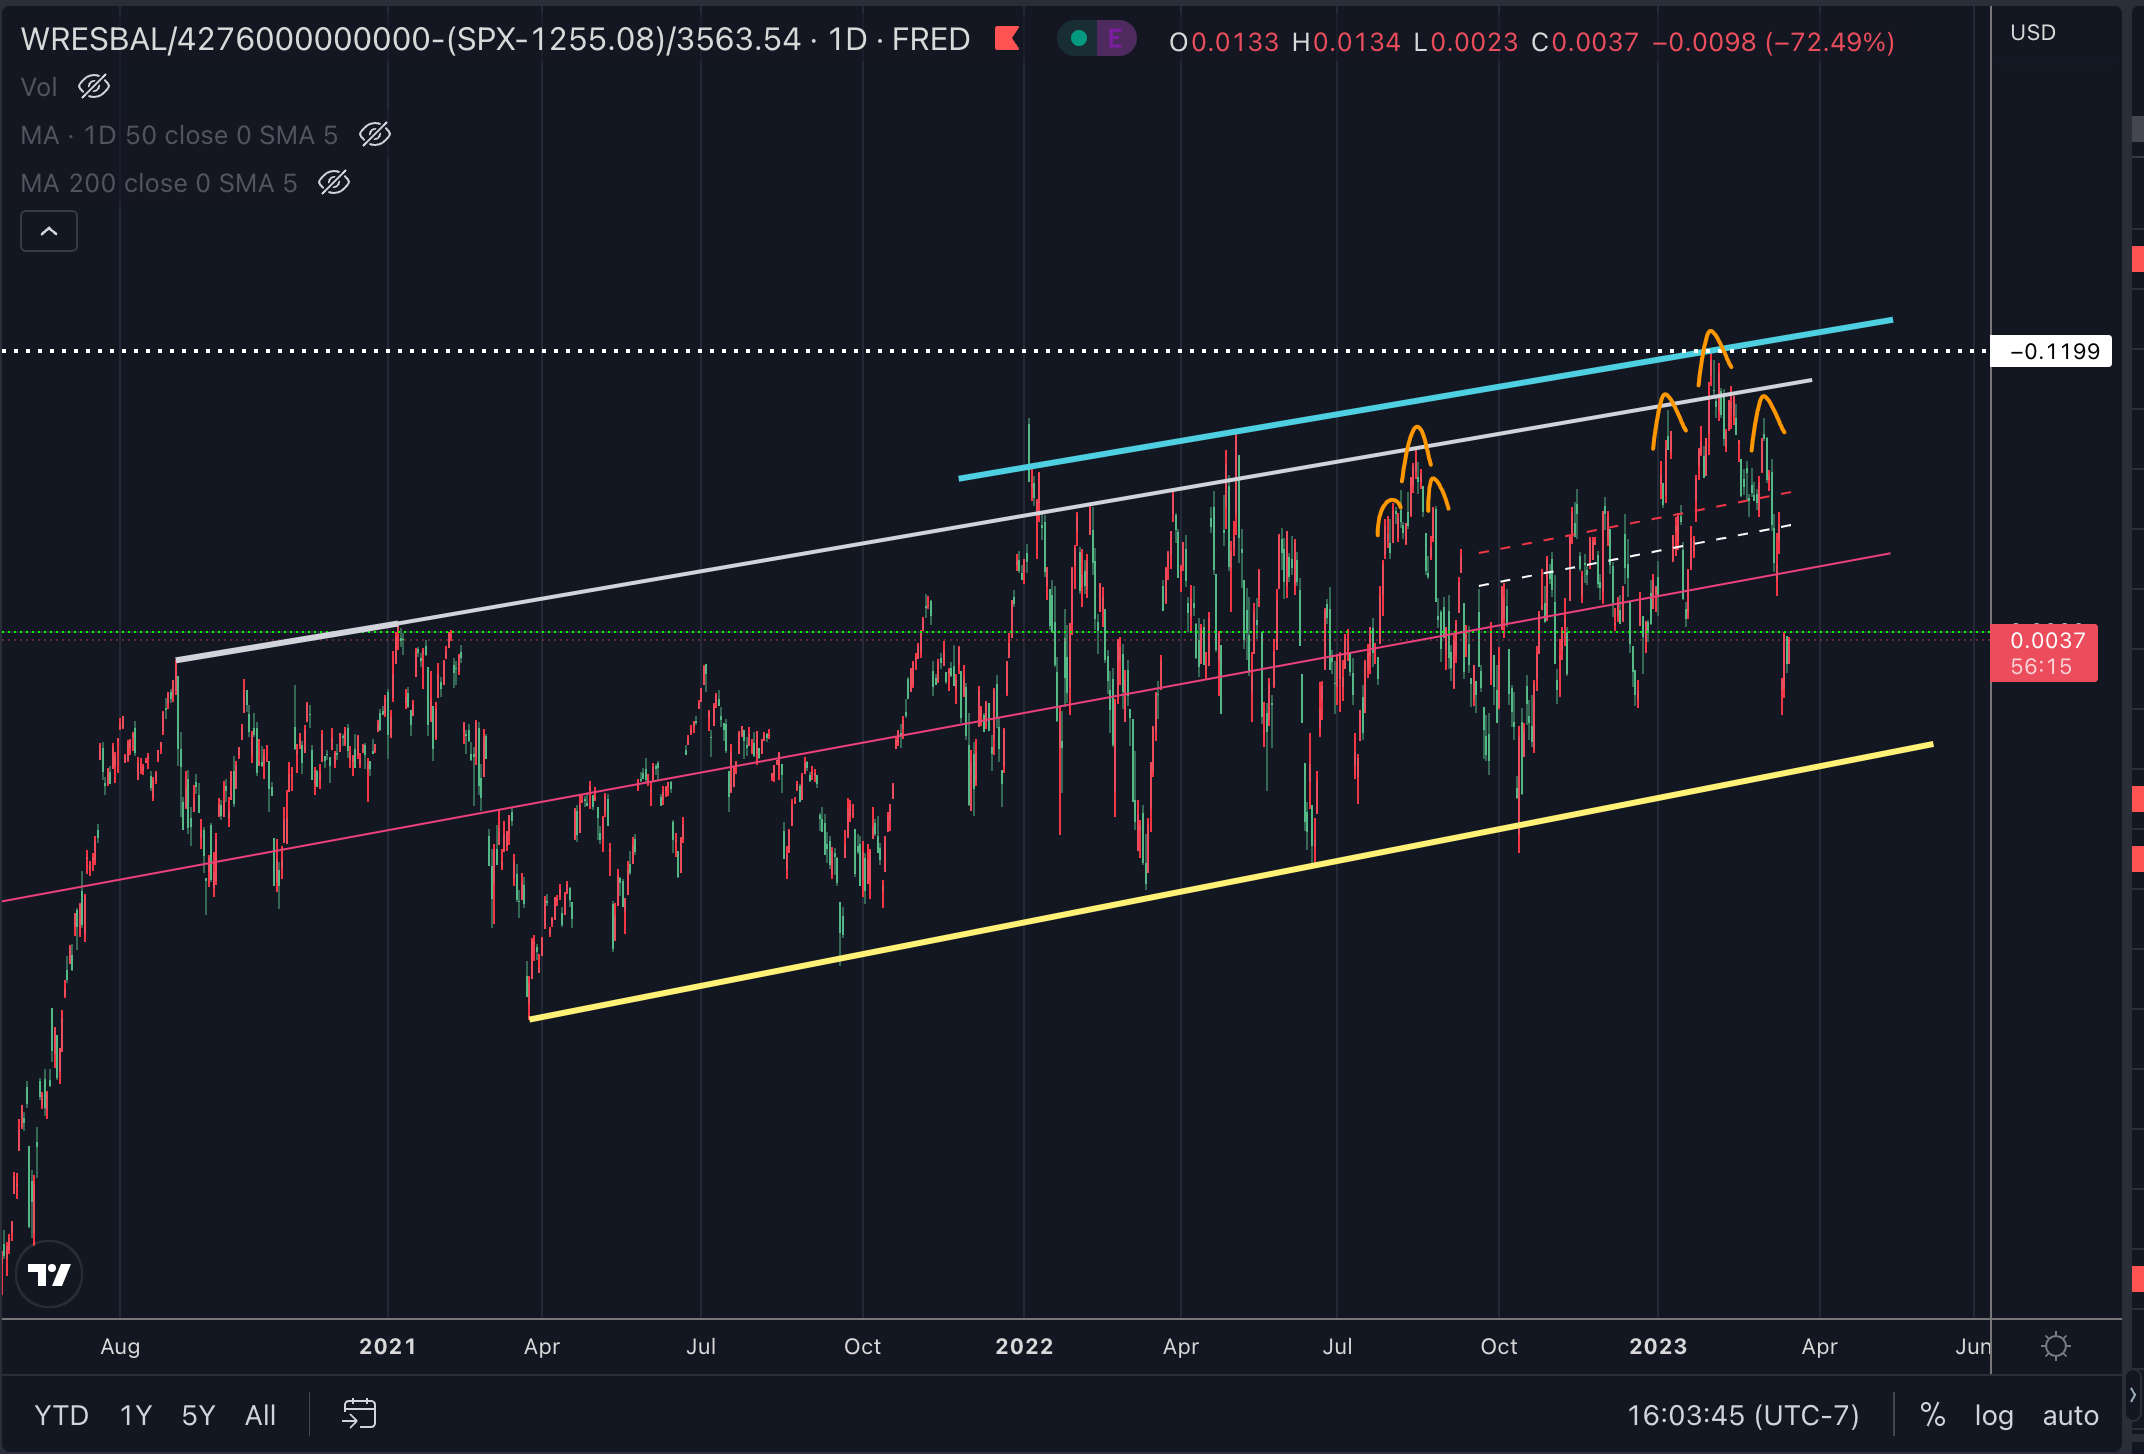
(WRESBAL/4276000000000)Subtract one from the other to get the divergence:
((WRESBAL/4276000000000)-((SPX-1255.08)/3563.54))*10 I multiplied by 10 to reduce decimal places. Positive means there's ample liquidity to support price, and extension in this direction may indicate an undervaluation. Negative: price diverged over liquidity levels that support the market.
Putting this equation into the ticker search bar in TradingView gives you this chart:

Note: Values pre-2008 are invalid because the equation is meant to evaluate price vs QE liquidity which only started in 2008.
Focusing on the channel that formed since the 2022 highs in SPX, it is apparent that the DEDO signal provides some structure I’ve been following this up and down swing trade structure since January 2023.
So far, the turn down in markets after the SPX high of 4195.44 has proven to be an opportunity to go short the market at DEDO “blue”, the upper channel bound shown in this chart:
What is DEDO 2.0?
After the first DEDO equation, and after many lessons were learned regarding liquidity in markets, I decided to level up and develop a DEDO TradingView indicator. The indicator includes more variables, including non-US central bank balance sheets. As it turns out, QE is not only something the US is capable of, and other countries have the capability to pump US stock exchange assets. This is why the new iteration of DEDO includes central bank balance sheet data and FX (currency) pairs:
// FOREIGN CENTRAL BANK ASSETS
Japan:  FRED:JPNASSETS * FX_IDC:JPYUSD
China:  CNCBBS * FX_IDC:CNYUSD
UK:     GBCBBS * FX:GBPUSD
ECB:    ECBASSETSW * FX:EURUSD
SNB:    CHCBBS
Korea:  ECONOMICS:KRCBBS*FX_IDC:KRWUSD
Canada: CACBBS * CADUSD
These formulas can be used in trading view, and sometimes it’s simple enough to combine a few of them to see a signal for where asset prices might want to go. Take for example the following formula that combines China, Japan, and European central bank assets in USD:
FRED:JPNASSETS*FX_IDC:JPYUSD+ECONOMICS:CNCBBS*FX_IDC:CNYUSD+FRED:ECBASSETSW*FX:EURUSD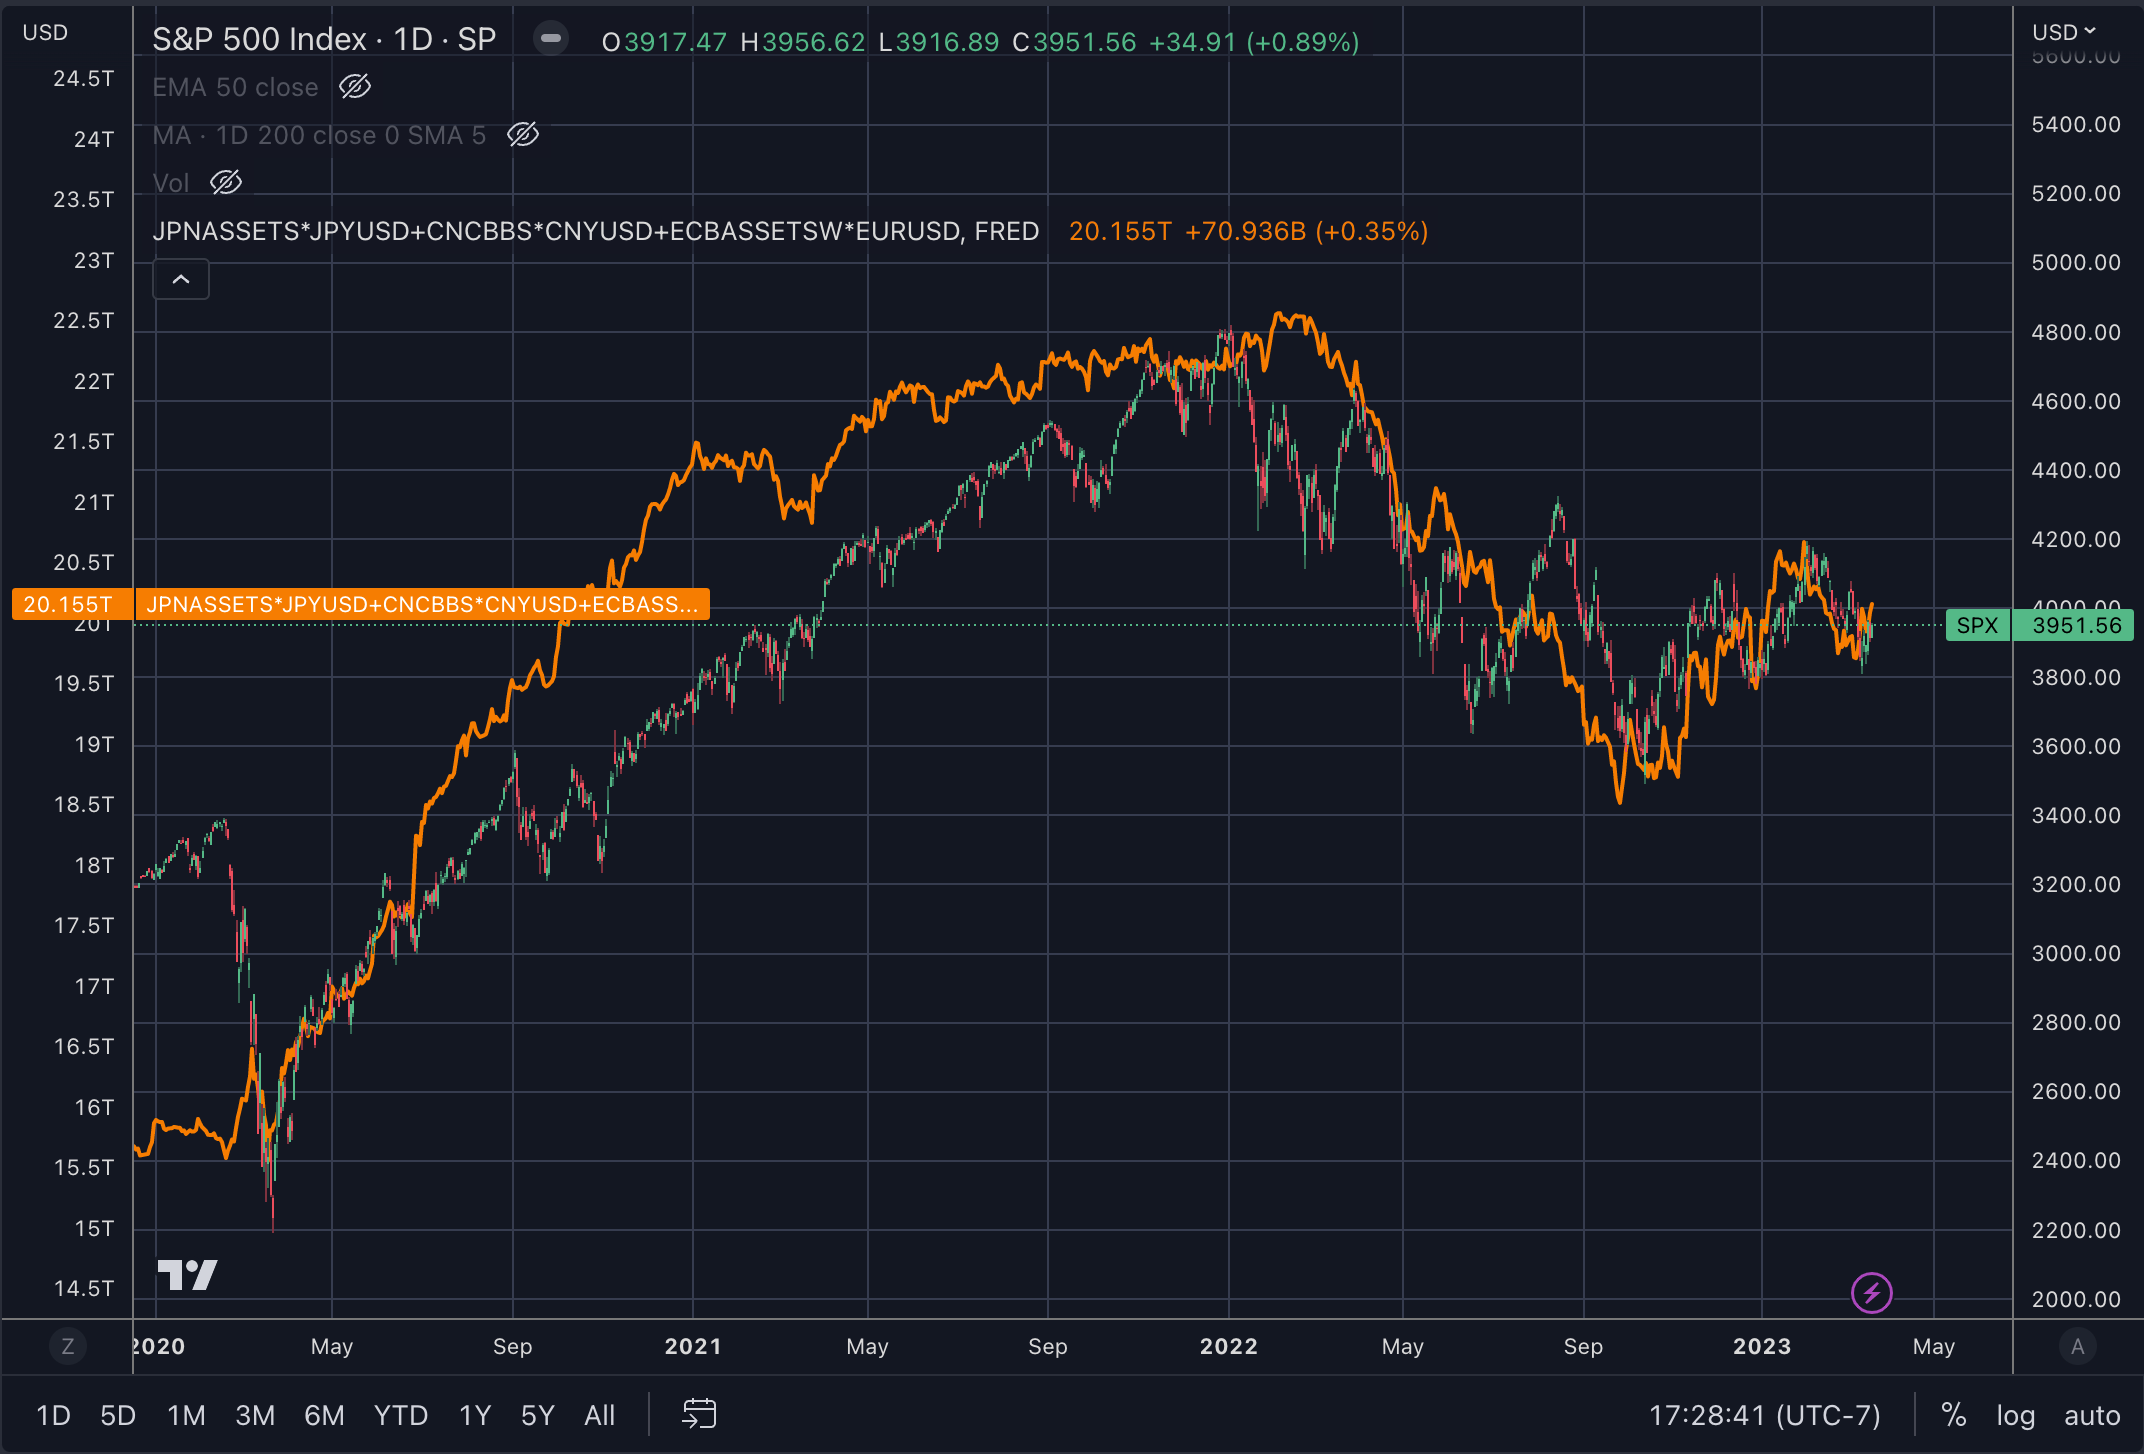
This is not a DEDO chart, but it shows that a few central bank assets can pretty closely resemble the SPX chart.
DEDO combines these central bank balance sheet assets, plus Federal Reserve balance sheet data, and factors in reverse repo balances, as well as non-QE assets to determine divergence. The total liquidity equation looks like this:
fed_liquidity = WRESBAL or (WALCL - TGA)
fed_final = fed_liquidity - reverse_repo - non_liquid_final


non_us_total = jpy_final + cny_final + gbp_final + snb_final + ecb_final + krc_final + cad_final

liquidity_total = fed_final + non_us_total

// apply normalization and divergence calculation...
The settings let the user decide which variables get used in the formula. Sometimes it might be desired to use (WALCL - TGA) vs WRESBAL, or sometimes it might be useful to exclude RRP (reverse repo), or exclude certain central banks from the equation.
DEDO on TradingView allows the user to customize the equation by excluding specific variables in the settings:
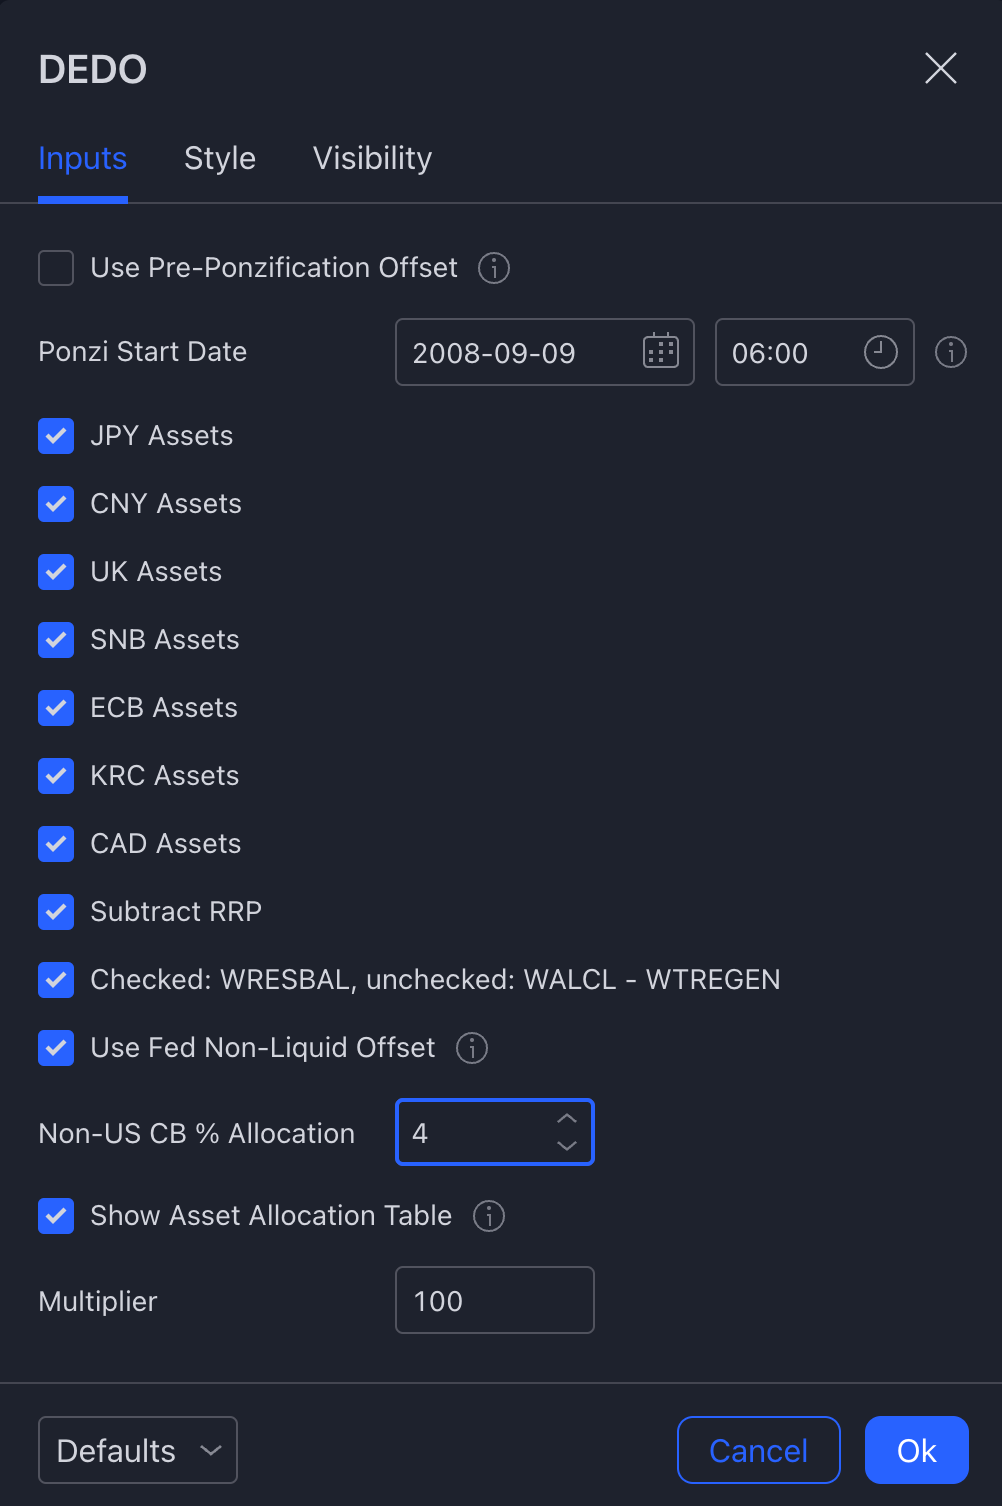
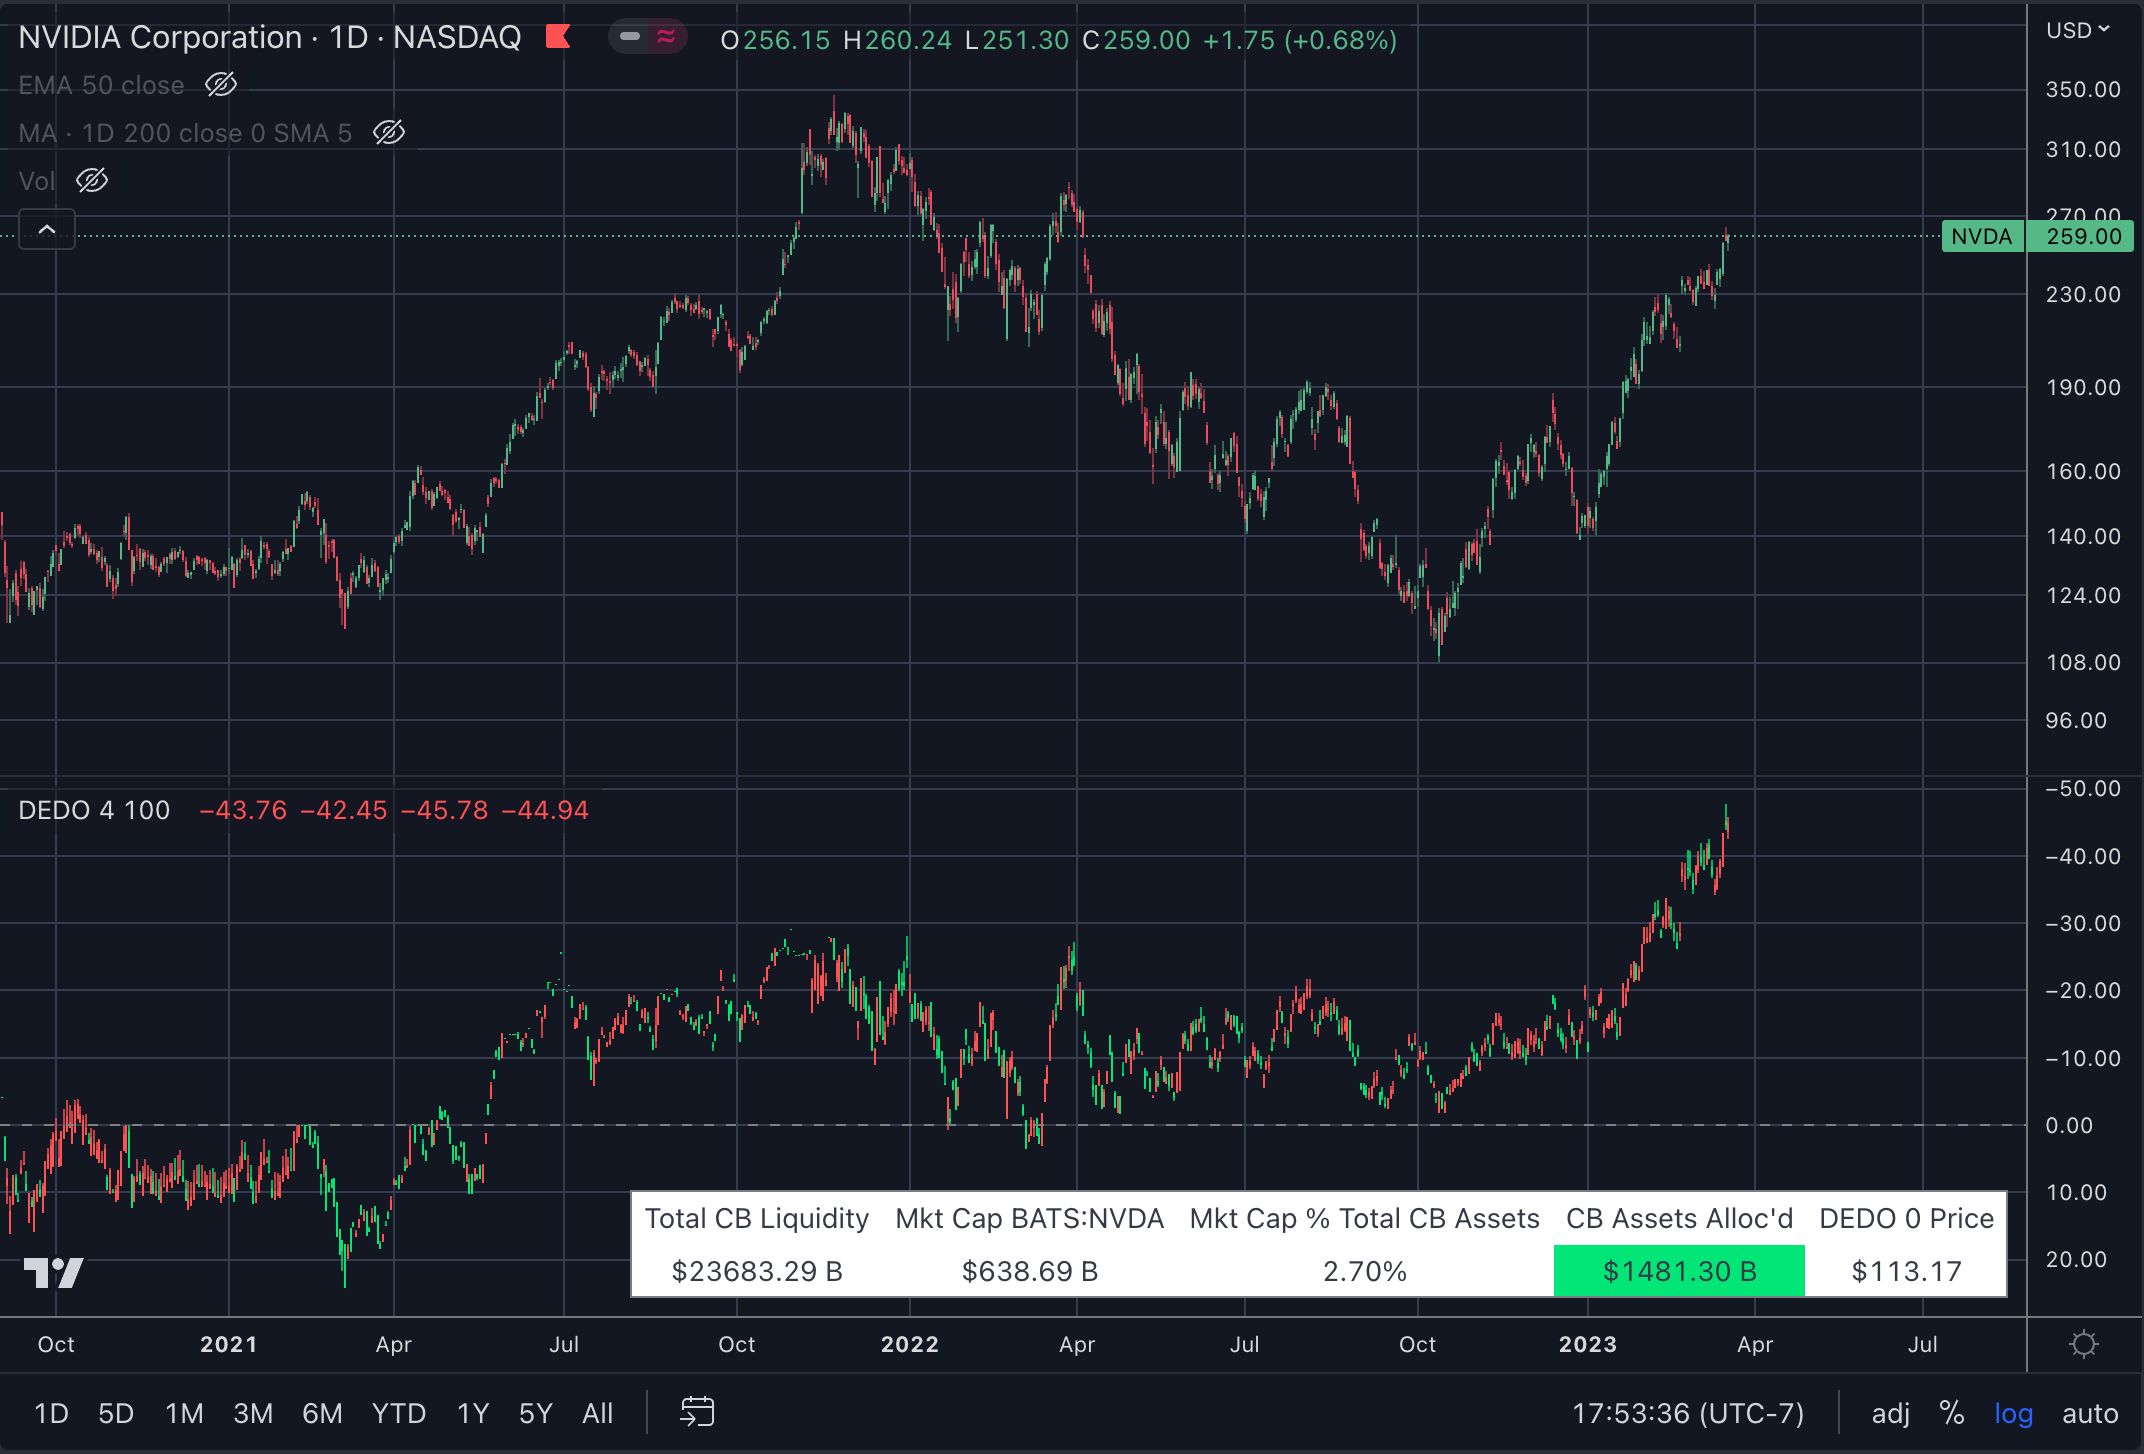
The Non-US CB % Allocation setting is a percentage of the total sum of all the included non-US central banks that are checked in the list. This is useful because the allocated amount for an asset, especially a single stock with a market cap of only a few hundred billion dollars should not necessarily be allocated trillions of USD.
Show Asset Allocation Table provides a table that can be useful in determining the right allocation for an asset based on the market cap. If CB Assets Alloc’d is green, then the allocation % is enough to cover the market cap calculated by TradingView.
Multiplier is a scaler that allows the user to tweak decimal places/sig figures in the DEDO result/chart.
Pre-ponzification offset allows the user to subtract the asset price on a specific date, such as the default which is when QE started to remove valuation pre-QE.
For some ideas related to DEDO check out some of my charts on TradingView, such as this idea that shows DEDO for TSLA.