Explainer: Implied Correlation Divergence Oscillator
A guide for TradingView indicator ICDO (Implied Correlation Divergence Oscillator)

In 2008 the Chicago Board Options Exchange (CBOE) launched an index called Implied Correlation Index. The index attempts to provide a signal for realizing the correlated volatility among stocks within the S&P 500 index. In particular it tracks options pricing for 50 stocks in SPX, where if all 50 stocks have similar implied volatility, and therefore options pricing, correlation is high, and if there is diversity in the implied volatility of the 50 stocks, then implied correlation is low.
Another way to think about this is high correlation means volatility across all stocks in an index is similar, and varying volatility between individual stocks means less correlation. An index could have low volatility if half of its stocks are down, while the other half are up, but the individual stocks in the index may have divergent volatility and the Implied Correlation Index attempts to indicate this divergence. Implied correlation tends to be higher when stocks are dropping, similar to the VIX (S&P 500 Volatility Index)
This is a chart of the relationship between the VIX and COR3M (Implied Correlation for 3 month at the money options)

Why Use ICDO?
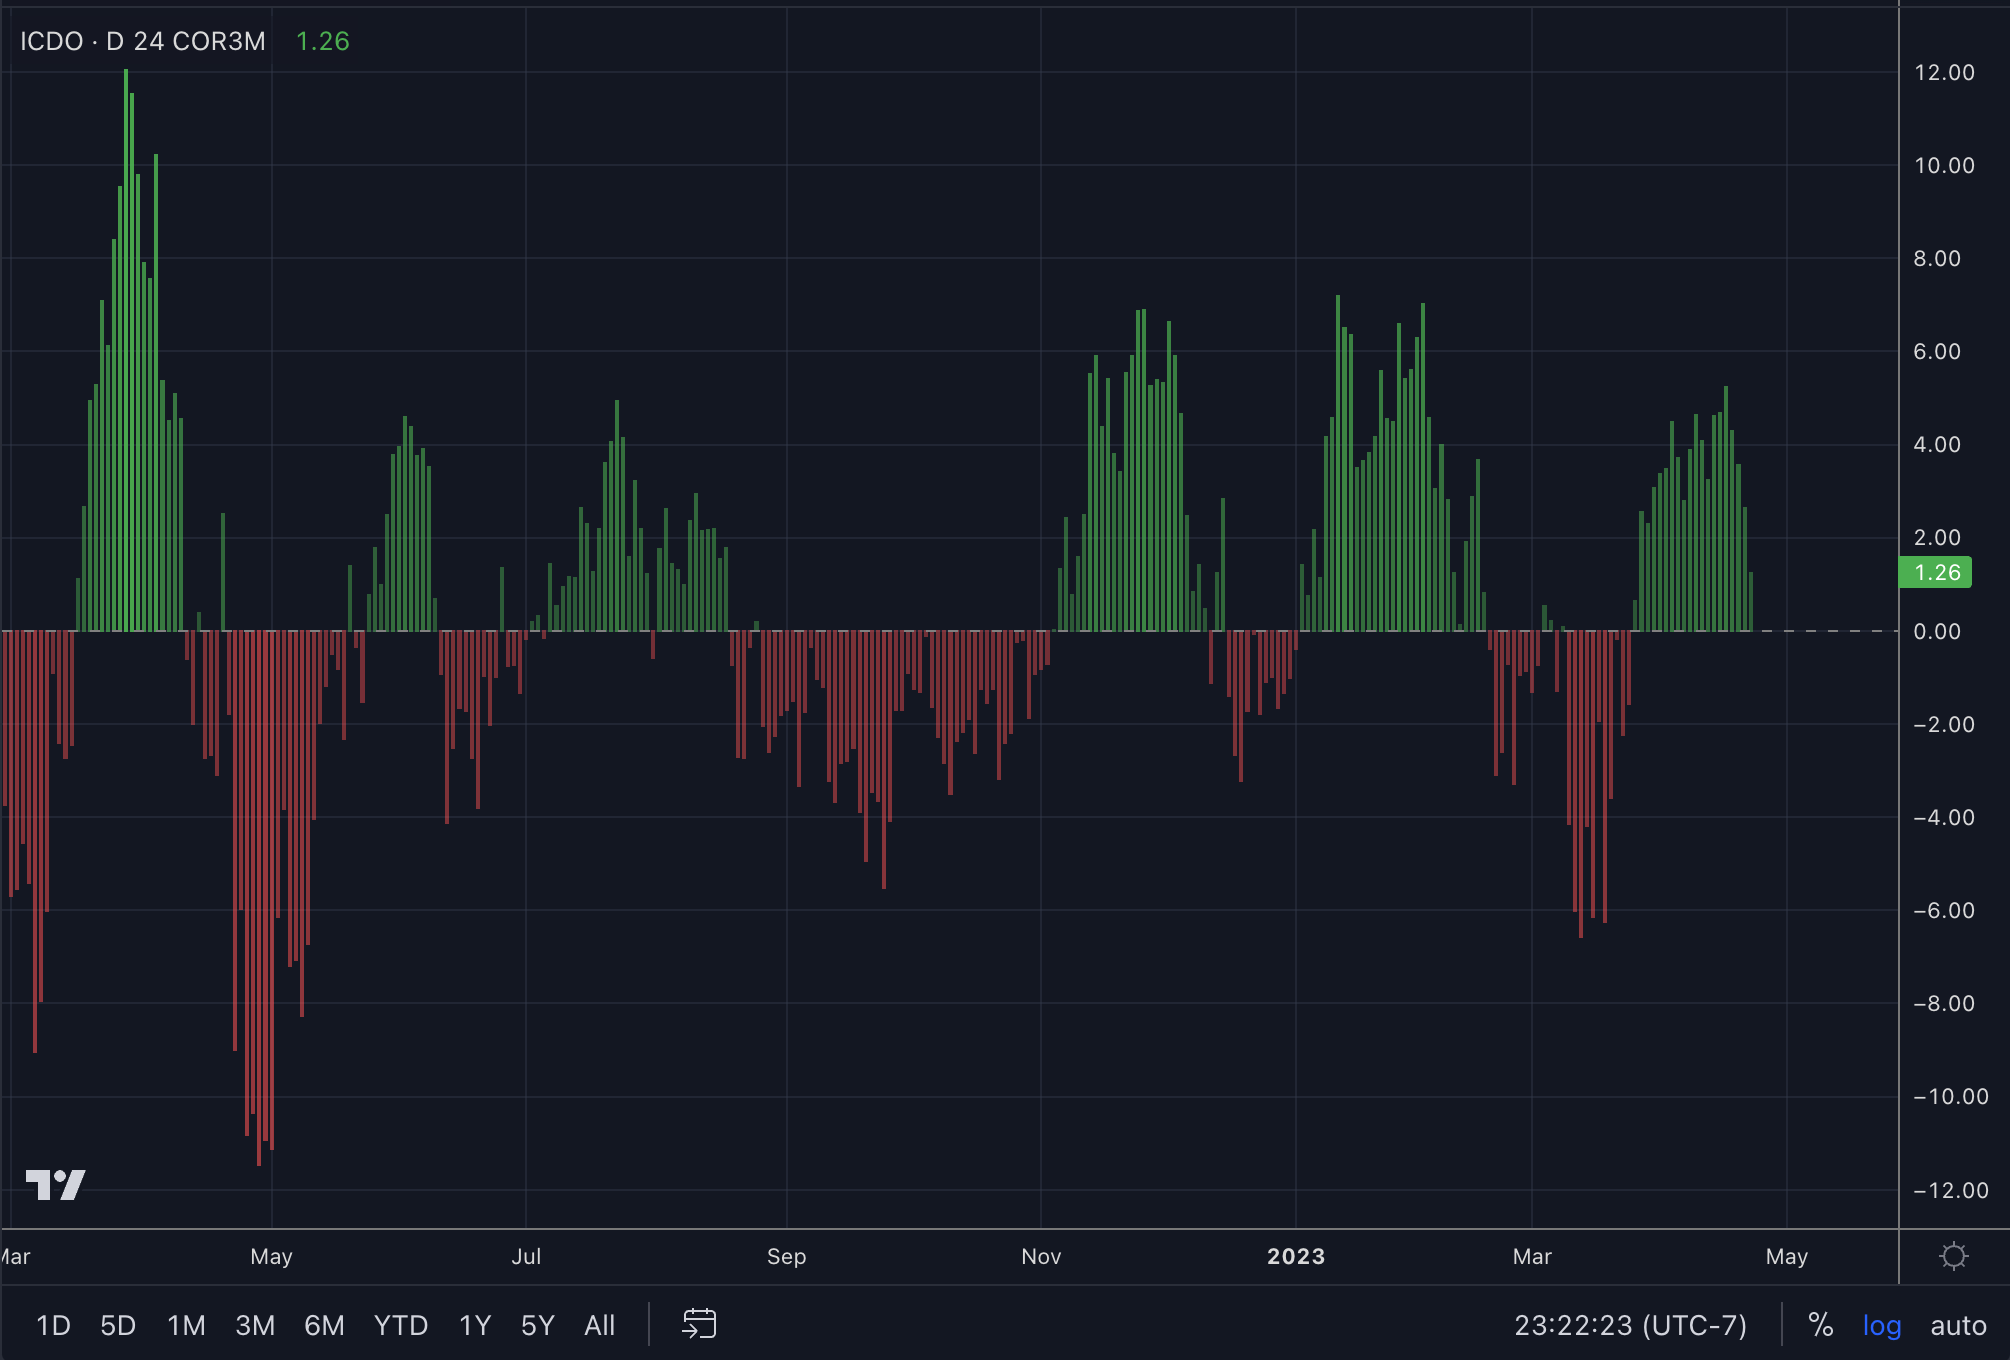
The ICDO indicator on TradingView is a tool that includes all of the CBOE indices for implied correlation on the different timeframes, and allows the user to configure a moving average divergence signal that indicates when the implied correlation index is reversing or showing signs of being overextended in either direction. To better clarify this concept here is a chart of COR3M with the 24 day simple moving average using the ICDO indicator.

When the oscillator (bottom) is green/positive it means the moving average configured in the settings is greater than the selected IC signal (COR3M in this case). When the oscillator is red/negative, the moving average is below the IC signal.
The defaults for ICDO do not display the raw signal and moving average. It is only the oscillator as shown here:
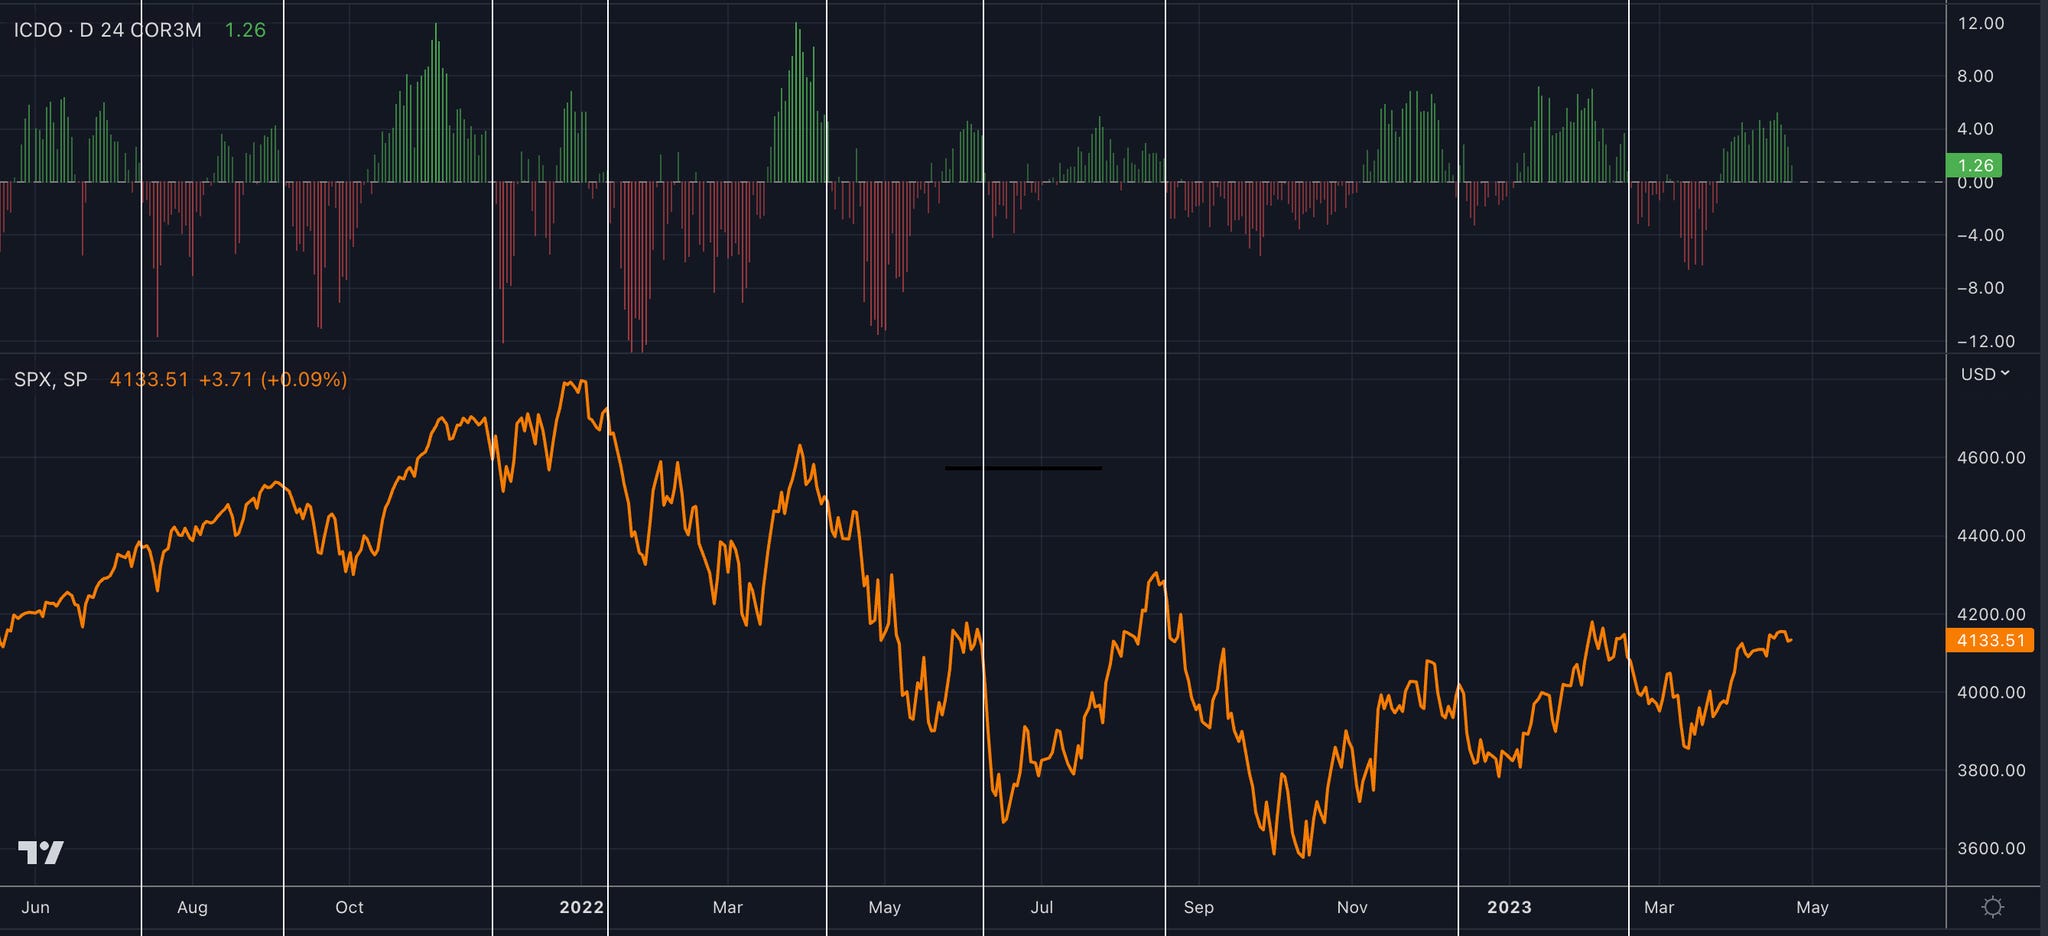
What makes this relationship interesting between the IC and MA, is an ability to sniff out tops and bottoms in SPX. Charting SPX next to ICDO exemplifies the relationship where ICDO crossings into the red often correlate with buying exhaustion in SPX (tops). Crossing into positive territory often correlates with selling exhaustion (bottoms)
ICDO Settings
ICDO can be configured somewhat similar to a moving average indicator on TradingView. The timeframe can be chosen independently from the chart timeframe, and the number of bars used in the moving average can be set. There is a setting for the specific IC indicator which includes all the available tickers offered by the CBOE.
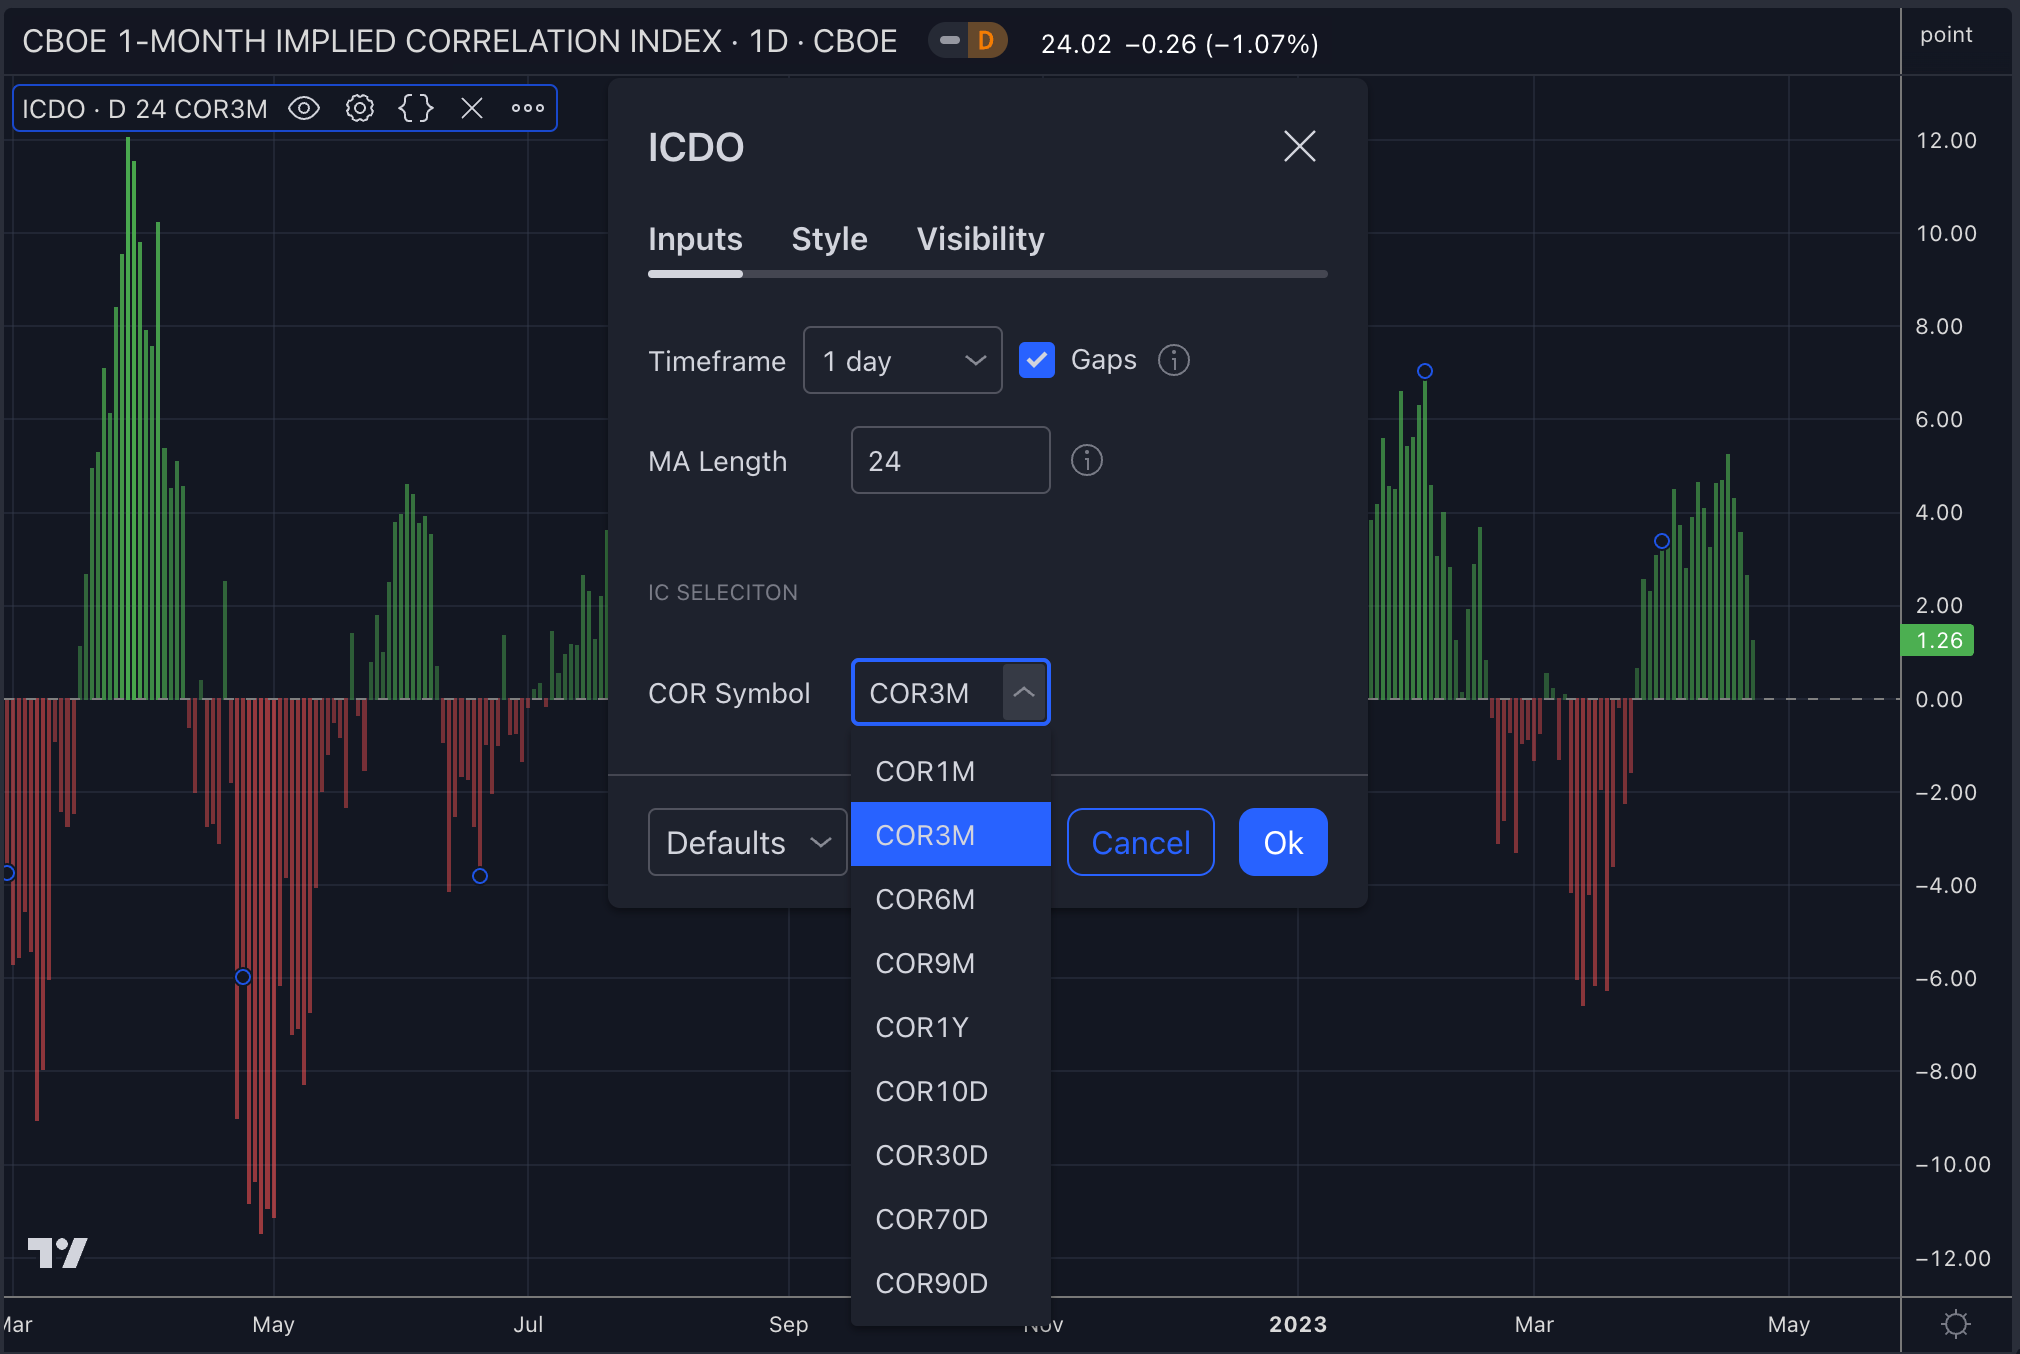
On the style tab there are optional settings to render the IC signal, and the moving average so that users can see the raw signals.

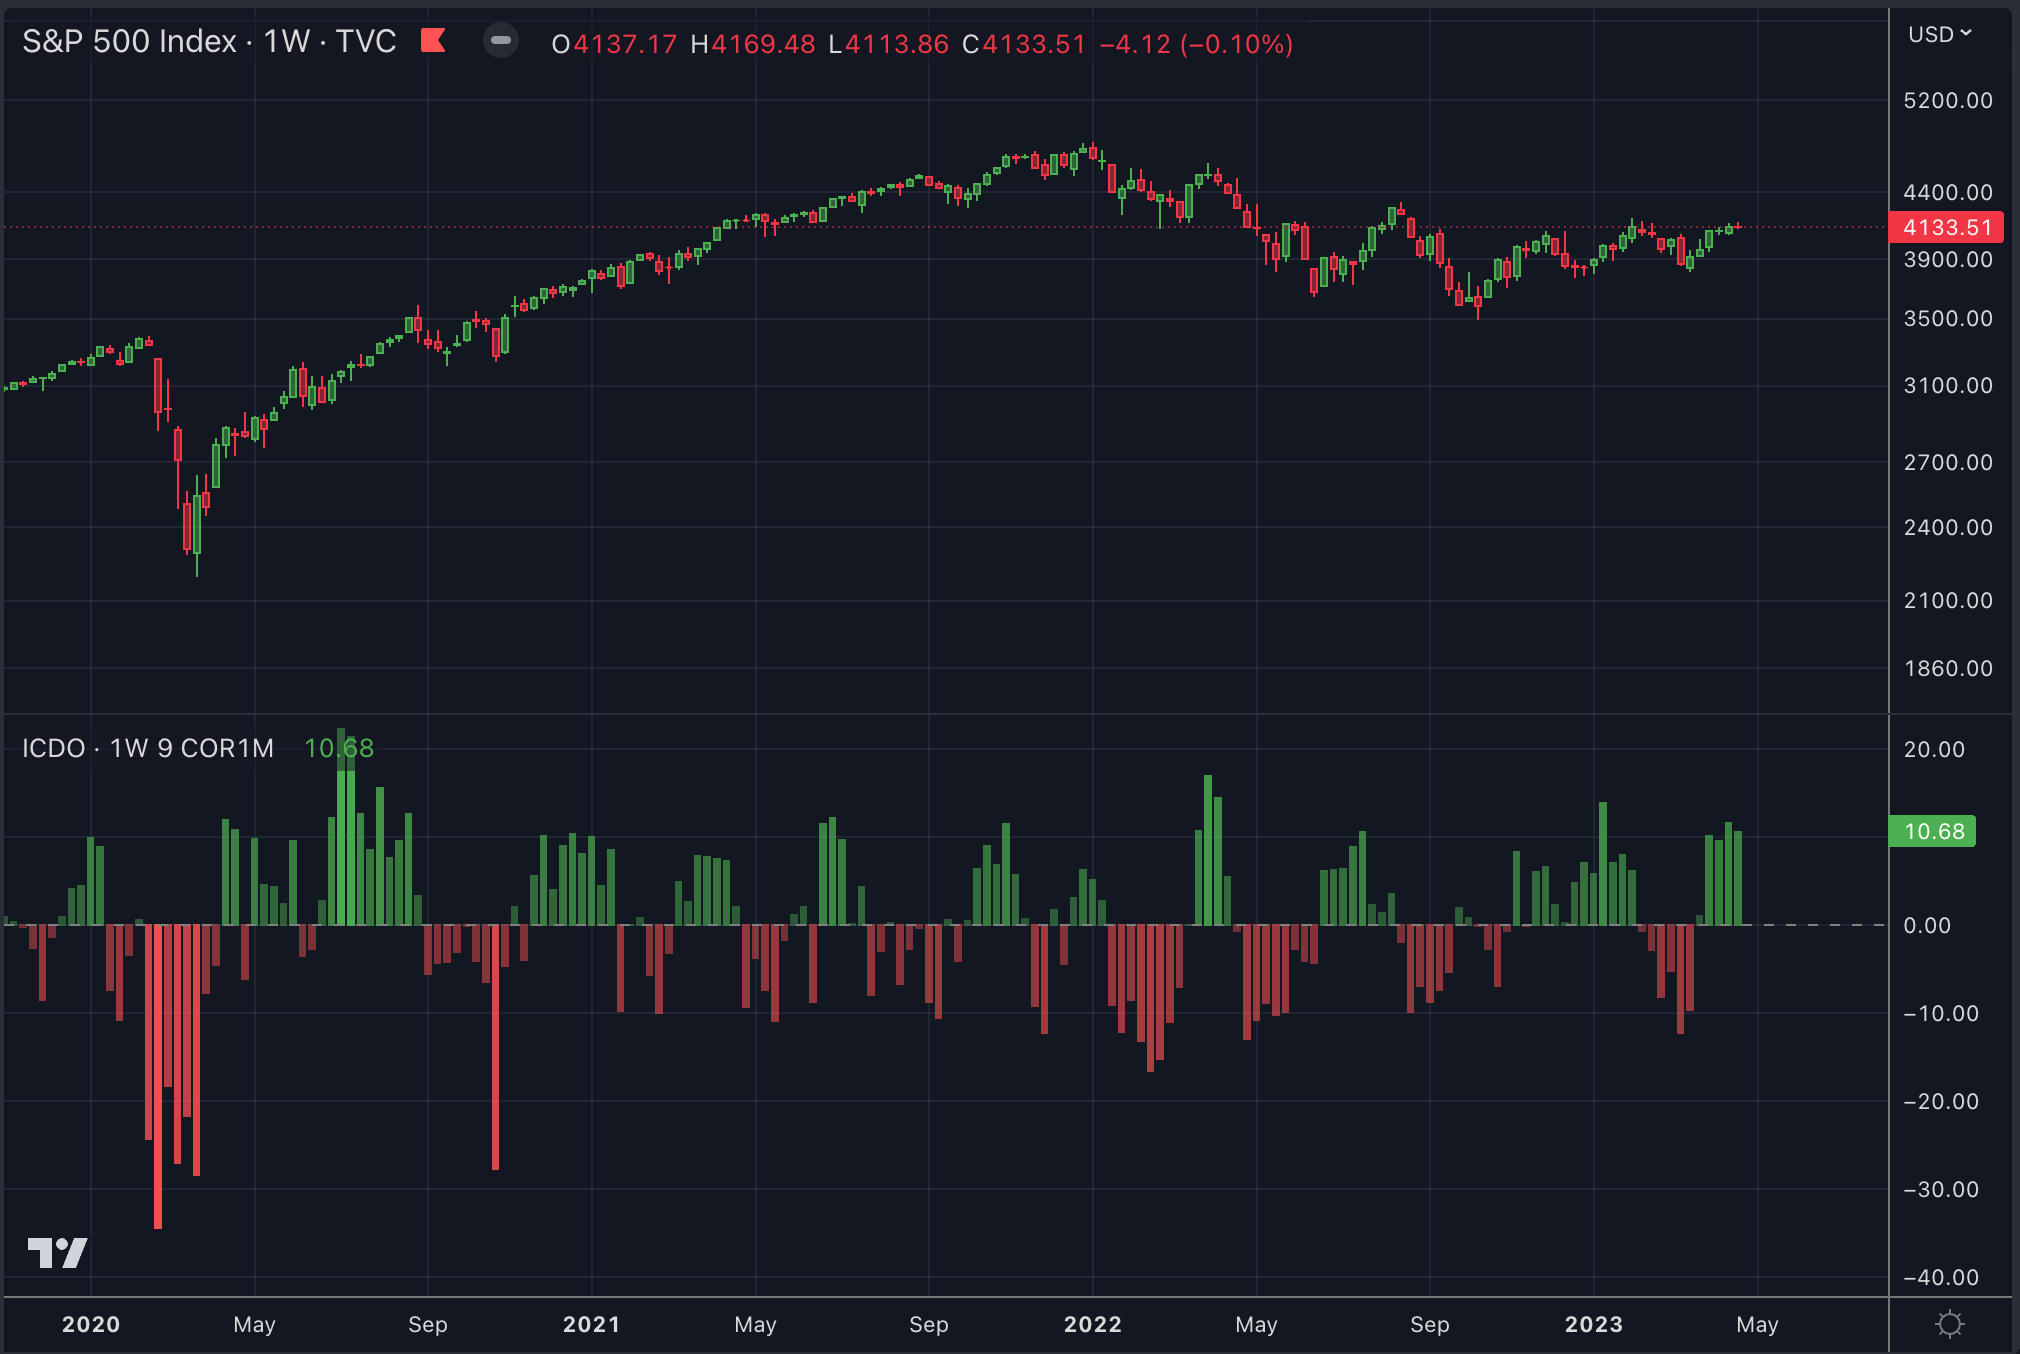
For example, here is a longer term SPX chart with weekly candles and COR1M using a 9 week SMA instead of the daily: