
Liquidity Report - September 18th, 2023
Liquidity Report - September 18th, 2023
A weekly liquidity update

FRED is updated weekly with new Fed balance sheet data including all the juicy details on liquidity. The following report captures changes in a variety of liquidity signals, and provides insights to determine the potential future outlook for asset prices and liquidity in global markets.
Fed Total Assets (WALCL)

Current balance: 8,098,779 Million USD
Weekly change: -2,539 Million USD
WALCL Components
The primary variables in WALCL (total assets) include the following balances:
Treasury Securities (WSHOTSL)

Current balance: 4,982,479 Million USD
Weekly change: -5,992 Million USD
Mortgage-backed securities (WSHOMCB)

Current balance: 2,498,870 Millions USD
Weekly change: 0 USD
Loans (WLCFLL)

Current balance: 249,615 Million USD
Weekly change: -950 Million USD
Thoughts on Fed Total Assets
There was not much of an assets reduction this week. Even loans have been showing signs of flattening out at a level near 250B. The BTFP (Bank Term Funding Program) balance continues to rise, but is also showing signs of flattening out

The term for the BTFP was originally a 1-year deal, so March 2024 would be the time frame to look for changes to the policy at the Fed, or banks are going to start sweating as interest rates have increased again since the March SVB collapse, and based on this BTFP balance increasing there must be banks that are still under stress holding assets with existential losses on their balance sheets, otherwise why would this balance go up?
Banks have been tightening lending standards further, and demand for loans is waning as well. The liquidity bounce that peaked in April was largely a result of the BTFP and discount window loan firehose at about 400B in two weeks. Now as liquidity falls back toward the lows that were being tested pre-BTFP, there are competing forces that continue to build with the dollar, reverse repo, QT, and treasury issuance.
Fed Liabilities (WLTLECL)
WLTLECL Components
The primary variables driving changes in WLTLECL (total liabilities) include the following balances:
Reverse Repurchase Agreements (WLRRAL)

Current balance: 1,835,634 Million USD
Weekly change: -64,244 Million USD
Treasury General Account (WDTGAL)
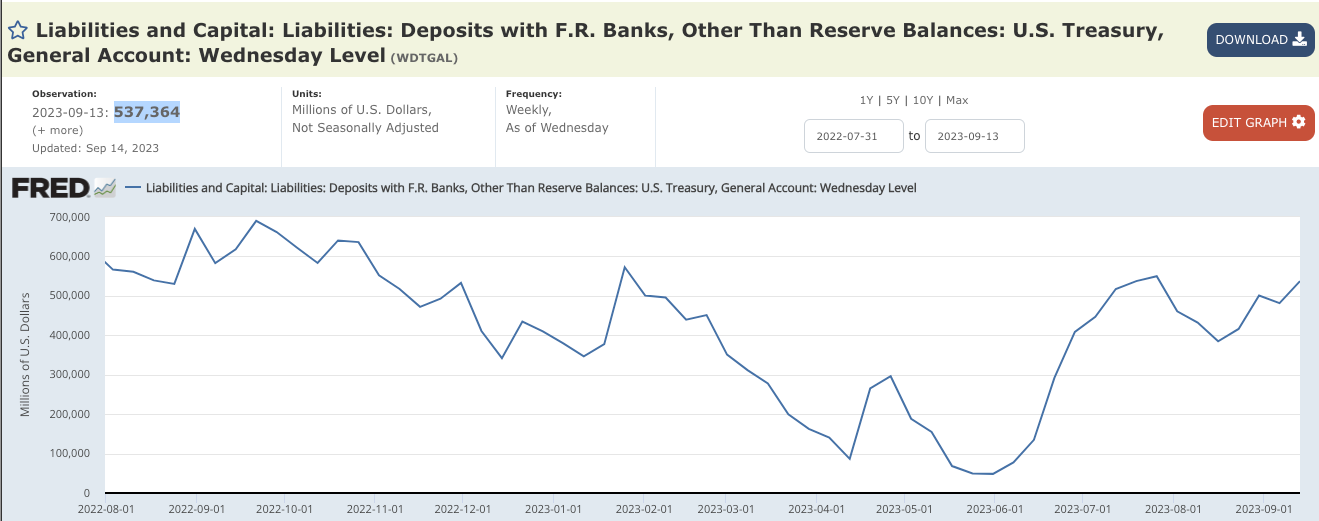
Current balance: 537,364 Million USD
Weekly change: 55,812 Million USD
Thoughts on Fed Liabilities
This week the reverse repo facility saw big outflows again, and after the weekly data print yet another 91B was ejected on Friday. This intense outflow comes near a level reached close to the top of SPX in late 2021.

RRP going below this level, and SPX not making a new high in the process represents a strong case for liquidity being absorbed by other assets. Bonds are a likely candidate for this distribution of liquidity because yields have climbed to a point where we have seen interventions before. Looking back at October of 2022 it’s possible that the playbook remains the same and the same line is being defended.
A chart of TLT vs RRPONTSYD paints the picture of a desperation attempt to keep yields from rising.

The stronger moves down in RRP have not been able to contain the long end of the curve as well recently. It is taking more capital from RRP to defend the line. This is also showing up in CBDET.

Notice the divergence between the inverse of the 10 year yield, and CBDET. This is telling me that what usually has control over the yields, is now becoming detached. Another way to think about this is to consider forces pressing on yields to go higher that are getting too strong to contain with the ammo left in the coffers of the players that have an interest in keeping yields down.
One of the forces that maintains pressure on yields is the supply dynamics in USTs and the treasury is in a spot where it has to issue debt…lots of it. This is due to the increased spending, and parabolic run-up in interest payments required to service the debt. On top of this, other central banks around the world are now faced with a dilemma: If they don’t sell treasuries now, the USTs they hold may be at risk of losing value as inflation expectations rise, and by selling those bonds they also add to the growing supply. If all the central banks are selling to avoid future losses…who is buying?
Non-US Central Bank Assets
The DXY is cooling off a bit now going into a new week after putting in its 9th straight weekly green candle.

The RRP flows may be an attempt at counterbalancing the liquidity forces of the dollar. As other countries are spending more dollars on Oil and other commodities, they pay in dollars and this puts more upward pressure on the DXY. So far the tension between the dollar (as well as yields) and reverse repo seem to have put assets in a distribution pattern going mostly sideways. For example take a look at the dollar, reverse repo and SPX:

It has typically been the case for months prior to late July that liquidity forces were moving in concert to create a bullish momentum. The TGA, RRP, and the dollar were all generally moving in favor of bullish markets for much of 2023. However, with the introduction of heavy treasury issuance, the pattern has changed. RRP no longer seems to have control over the dollar or SPX like it used to. Much of this liquidity is probably being absorbed into bonds, just in order to keep the house of cards from falling over. Given that there is roughly 7 Trillion USD in foreign held US debt, and only 1.4 Trillion left in reverse repo it’s possible that a foreign sell-off of the US debt could easily absorb all of reverse repo. The liquidations may not be allocated to stocks or other assets, but instead prioritized to commodities necessary to maintain production of necessities and exports. If liquidity capacitors run completely dry, then what’s next? Forced selling of other assets such as equities, gold, Bitcoin, real estate, etc?
Bitcoin
WRESBAL is up by 28B this week, its 3rd up week in a row. This puts the WRESBAL line at $29,000

Last week I talked about how BTC was undervalued against the liquidity line, and it has made some gains since then. I still tend to think that the 200 week moving average will be a key resistance at $27,870, and there are all the other liquidity forces at play making this a tough call in the crypto arena.
Bitcoin is also an asset that tends to respond to RRP quickly, and as of late has been meandering sideways while RRP ejects hundreds of billions. This is likely due to the bond issuance absorbing the outflows as discussed in the prior section. Considering the dollar is up 9 weeks in a row, it is quite incredible how resilient BTC has remained in the current environment. I tend to believe that the selling of USTs will remain strong, keeping yields moving higher. If RRP continues to drain and support issuance at the treasury then maybe the dollar will cool off a bit and Bitcoin can retest the 200 week, or the WRESBAL line in that scenario. If the plunge protection team loses control of yields, and the dollar rips higher as well as commodities like oil, it will be interesting to see how Bitcoin reacts. My assumption is that the liquidity priority will be placed with necessities like oil, copper, and other goods needed for manufacturing, and this means Bitcoin might be more aligned with the expendable risk-off category.
Conclusion
Oil and the dollar are ripping higher while RRP ejects a firehose of pump juice all over the markets. Treasury issuance and USTs being sold by foreign entities may be the reasons for rising yields into an over-supplied bond market. Stocks and Bitcoin appear to be in distribution as the competing forces battle at a critical line for yields and TLT. There is data indicating that forces on yields to the upside are growing harder to counteract. We’ll continue with the play-by-play weekly right here in the Liquidity Report so stay subscribed for updates!