

Liquidity Report - August 4th, 2023
Liquidity Report - August 4th, 2023
A weekly liquidity update

FRED is updated weekly with new Fed balance sheet data including all the juicy details on liquidity. The following report captures changes in a variety of liquidity signals, and provides insights to determine the potential future outlook for asset prices and liquidity in global markets.
Fed Total Assets (WALCL)

Current balance: 8,206,764 Million USD
Weekly change: -36,580 Million USD
WALCL Components
The primary variables in WALCL (total assets) include the following balances:
Treasury Securities (WSHOTSL)
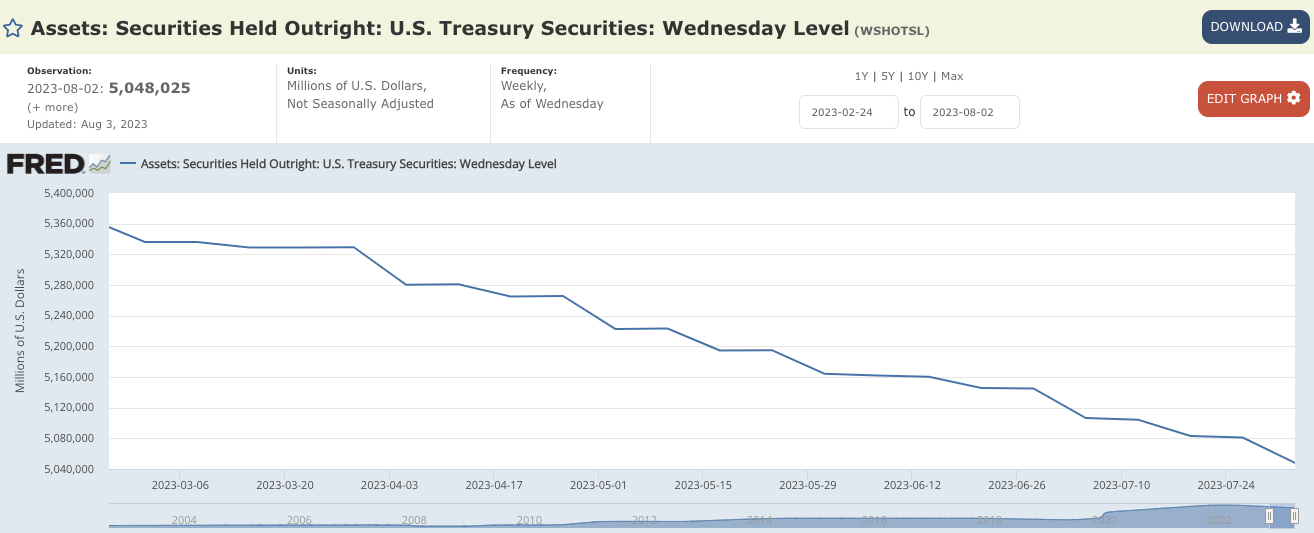
Current balance: 5,048,025 Million USD
Weekly change: -32,956 Million USD
Mortgage-backed securities (WSHOMCB)

Current balance: 2,517,559 Millions USD
Weekly change: 0 USD
Loans (WLCFLL)

Current balance: 262,111 Million USD
Weekly change: -4,261 Million USD
Thoughts on Fed Total Assets
There’s a bit of a tick-tock theme going on here when it comes to MBS and Treasuries. This week MBS was flat with no change, but Treasuries, especially notes and bonds were hammered down. I mentioned this was coming in the previous report based on the scheduled roll-off, and was curious to see what the effects in markets would be knowing that the TGA and reverse repo facility were settling into a stable level.
The over 31B maturity drawdown was scheduled for Monday, so the whole week includes the effects from this, and the bearish engulfing formation on the weekly QQQ and SPY charts speak for themselves.

It’s also the beginning of the month, so there were TGA outflows, and RRP did become volatile for the end of month July close and early August open, which we’ll get to in the liabilities section.
The loans balance is once again down by over 4B adding yet more stealth QT to the mix. BTFP is the talk of the town because it’s been going to new highs, but it doesn’t match the drawdowns in the discount window loans. This may be due to the discount window 60 day term vs the much longer term for BTFP, but that’s only a theory. Regardless, WLCFLL has to be looked at for the complete picture in terms of how much liquidity is actually still lingering from loans.

Here’s the table with the complete loan data, and as you can see, the high level “Loans” category is down overall, while the BTFP sub-category was up.

Fed Liabilities (WLTLECL)
WLTLECL Components
The primary variables driving changes in WLTLECL (total liabilities) include the following balances:
Reverse Repurchase Agreements (WLRRAL)
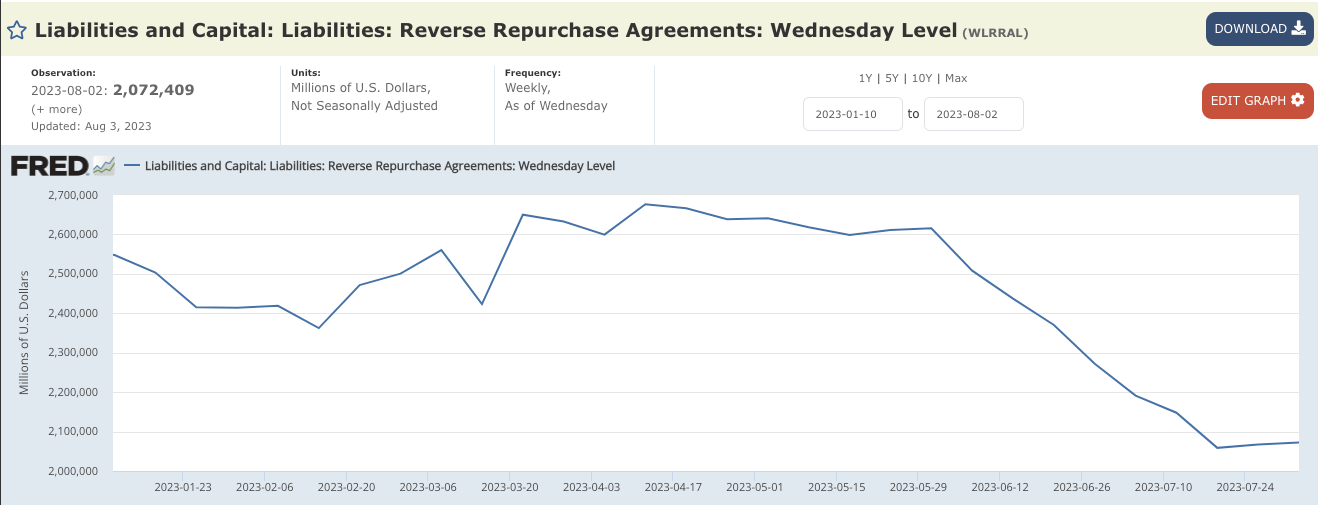
Current balance: 2,072,409 Million USD
Weekly change: 5,434 Million USD
Treasury General Account (WDTGAL)

Current balance: 460,926 Million USD
Weekly change: -88,971 Million USD
Thoughts on Fed Liabilities
Last week I discussed the importance of a reversal in RRP after weeks of outflows, and this week we had our second inflow data print in a row for RRP. However, the TGA is draining a bit later in the week down to a level that puts the weekly swing at about 89B, which is quite significant.
Because the Monday QT was early in the week, and the TGA outflow effects lag a bit more as well, it might add some support to assets, and create a squeeze if bears get overzealous shorting a hole. This would likely be a short lived short covering rally as a reaction to early month outflows, and the treasury would likely slow the outflows and issue more debt to refill the TGA to target levels somewhere near the mid-500B range.
Non-US Central Bank Assets
The DXY is on a rampage, and we talked extensively about this last week as the ECB was finished with TLTRO QT until June of 2024, and the Fed should now take over as the faster paced tightening regime.

The move in the DXY cooled off a bit on Thursday, but zooming in on the daily, the 50 daily moving average is currently acting as a support retest level, with a golden cross imminent if the 50 day can start to cup upward.

The falling wedge (or bull flag) pattern perfectly aligns with levels from the Y2K era. The technicals and fundamentals for the DXY are really lining up these days. If you missed last week’s report I highly recommend going back and reading the more detailed ECB research. The thesis is already playing out, and if the QT differential continues at least until June of 2024, this could be a heck of a 2nd half of the year for the dollar.

Stocks and Bonds
The big story this week was the Fitch rating adjustment from AAA to AA+, but it really only adds a narrative to what was already in the works. Does it help with the situation? No, of course it adds fuel to the fire, but this thing was already burning red hot before any news about a downgrade.
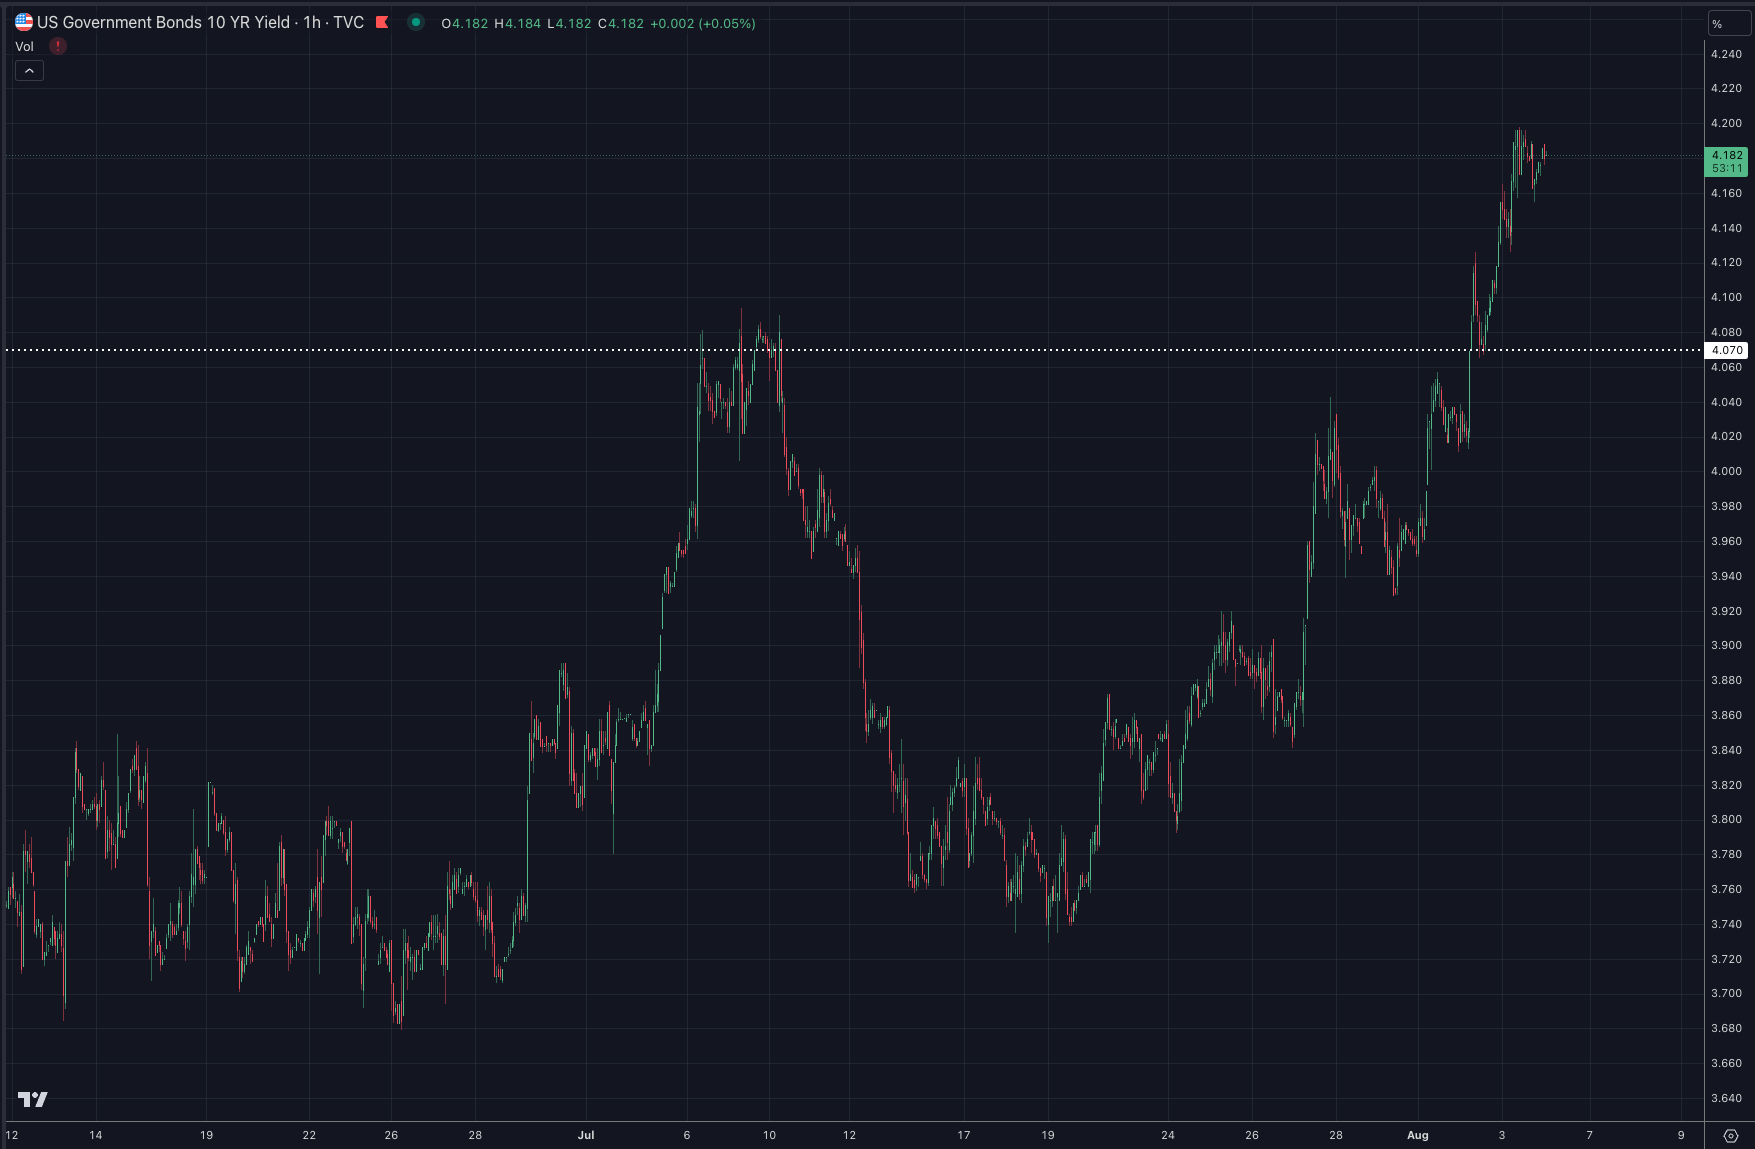
This week’s liquidity report is the first one in August, which means full July data is in and being digested. My gut says that it was only going to take a bit of time for a bond market reaction to occur in relation to July data. What data, you ask?
This is the month that inflation will likely bounce, and inflation expectations going up is likely a major factor in bond selloff on the long end of the curve. First, let’s take a look at the move in the 10 year yield.
I explain the inflation outlook expectation in 3 steps:
Commodities/Dollar weakness
Liquidity lag effects
Base effects
For all the details please check out my X thread that goes through each step.
DBC (Commodities Index) paints the picture in monthly candles. Remember, the moves after July close don’t matter for the print we are about to receive in August, and the month of July was a spicy one for commodities.

It seems rather obvious what will happen next, but as smarter analysts absorb the data, and the long end yields rise, it’s pretty clear that this is being priced into the bond market.
What isn’t so obvious is that the lag effects due to liquidity might make this a short duration bounce.

The chart above shows the lag effect from WRESBAL which is a Fed liquidity metric that makes it simple to see the relationship. Liquidity tops, and 203 days later, inflation tops. We’re now about the same amount of days from the time liquidity bottomed, which means inflation may have bottomed here as well.
But look what happens next. Liquidity comes down shortly after this, and so one might expect a bounce in CPI to be transitory. If this is the case, then a freak out reaction in the bond market might be an opportunity to scoop up long bonds on a dip. Just be careful catching falling knives as the 10 year goes parabolic ;)
Bitcoin
WRESBAL moved up 17.3B this week, and the price line moves up to about 25k. I’m still looking for a retest of the 200 week moving average, but the 29k support continues to hold.

As liquidity has dried up even more, and the dollar breaks out of a long term falling wedge, it’s hard to imagine a very long wait until the next correction wave down. As bonds get slammed due to a number of factors, it’s also worth noting that Tether is a holder of USTs. If a run on the bank starts due to worries of liquidity issues, there can be dire consequences in the crypto space. Binance is also under the radar now with a potential fraud case looming.
Conclusion
Global liquidity per my indicators continues to drain and come closer to making a new low since it came down from the top in early 2022. Asset markets are correcting and feeling the pressure, but an early month outflow from the TGA might help to cushion the blow before the week closes with a bearish engulfing on SPX and QQQ. The bond market is reacting to a number of issues, including ratings downgrades, longer term issuance, and inflation expectations. With QT at the Fed starting to outpace the ECB the DXY is climbing. A lot of things are lining up for liquidity pressures to really start taking their toll on asset valuations, and the economy, but time will tell, and you’ll want to be subscribed to follow the liquidity story.